Renewable Electricity in Gwynedd, Anglesey & Conwy
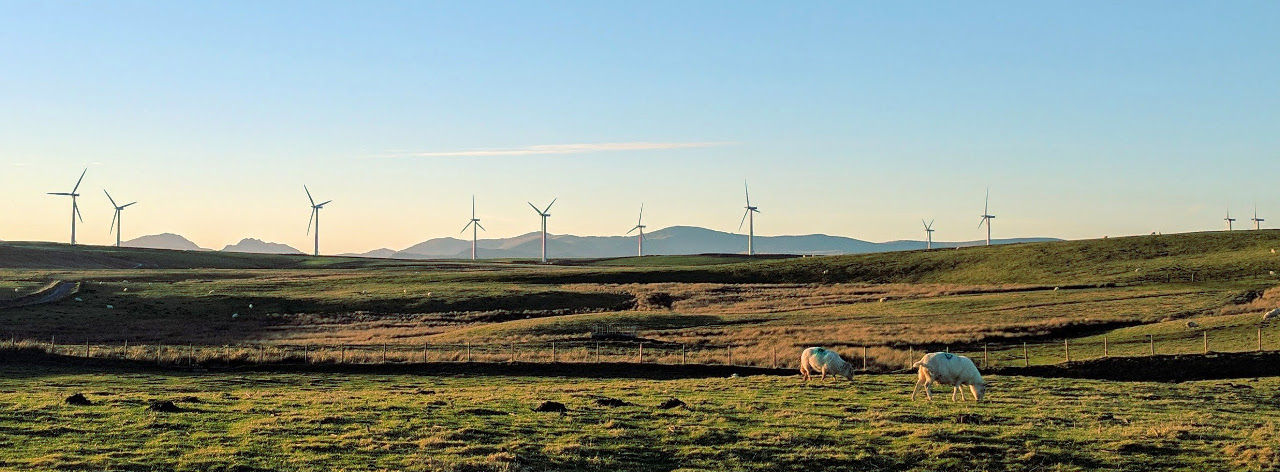
Moel Maelogen Wind Farm, Conwy, 15.6 MW
The following figures give an overview of renewable energy capacity, output and electricity demand in Gwynedd, Anglesey & Conwy based on 2016 data. See sources below.
Renewable Electricity Capacity, MW
| Gwynedd | Anglesey | Conwy | |
|---|---|---|---|
| Solar | 42.9* | 35.1 | 5.0 |
| Onshore Wind | 4.7 | 39.2 | 19.4 |
| Offshore Wind | 0 | 0 | 666 |
| Hydro | 57.5 | 0 | 33.8 |
| Other | 2.7 | 1.0 | 3.6 |
| Total | 94.0 | 75.3 | 727.7 |
Renewable Electricity Output, GWh
| Gwynedd | Anglesey | Conwy | |
|---|---|---|---|
| Solar | 37.9* | 35.2 | 4.3 |
| Onshore Wind | 5.3 | 84.6 | 48.4 |
| Offshore Wind | 0 | 0 | 1850.5 |
| Hydro | 98.7 | 0 | 65.2 |
| Other | 3.9 | 1.6 | 16.0 |
| Total | 145.8 | 121.3 | 1984.5 |
Onshore wind output was 20% less and hydro 17% less in 2016 than in 2015.
Offshore wind and solar output was higher,
overall renewable generation was 3.7% less.
Electricity demand, GWh
| Gwynedd | Anglesey | Conwy | |
|---|---|---|---|
| Domesic | 253 | 151 | 203 |
| Non-domestic | 288 | 145 | 192 |
| Total | 541 | 295 | 394 |
While domestic consumption increased in all three local authorities by 2% in 2016 compared to 2015. Non domestic consumption dropped by a surprising 27%!?
Consumption per household
| Gwynedd | Anglesey | Conwy | |
|---|---|---|---|
| Households | 58008 | 33204 | 53631 |
| Domestic Meters | 62000 | 35000 | 56000 |
| Non-domestic Meters | 9000 | 4000 | 6000 |
| Domestic mean consumption | 4695 kWh (12.9 kWh/d) | 4870 kWh (13.3 kWh/d) | 3878 kWh (10.6 kWh/d) |
Renewable electricity supply
| Gwynedd | Anglesey | Conwy | All | |
|---|---|---|---|---|
| Percentage supplied | 27.00% | 41.10% | 504% (34% w/o offshore wind) | 183% (32.6% w/o offshore wind) |
Population density of Gwynedd, Anglesey and Conwy is about 20% of England and Wales average. (0.7 persons per hectare vs 3.7).
If we include the offshore wind farms (gwynt y mor and rhyl flats) off the North Coast renewable supply exceeds local electricity demand, without these schemes renewable energy supplies 32.6% of electricity demand in Gwynedd, Anglesey and Conwy.
Renewables share of UK wide electricity generation was 26.6% in 2017 Q1, Nuclear supplies 21% of electricity demand, which brings the zero carbon total nationally to 48%.
Future domestic electricity demand
The above figures are of course for electricity alone, total energy includes oil, gas, coal for space heating, water heating and transport. Figures for these are available in the Gwynedd Werdd report for further context.
We can however estimate the impact of heating and transport electrification on future domestic electricity demand in-line with the ZeroCarbonBritain Scenario developed by The Center for Alternative Technology in Machynlleth.
The ZeroCarbonBritain scenario is underpinned by a detailed 10 year hourly energy model and extensive analysis of energy demand and generation across the whole energy system. We can however simplify the core parts of the scenario in order to get a back of the envelope understanding of what might be possible.
Lighting, appliances & cooking: 4.5 kWh/d per household
ZeroCarbonBritain suggests that with energy efficient appliances, LED light bulbs etc, traditional electricity demand can be reduced to 4.5 kWh/d per household. This would represent a 60% reduction on our mean consumption figures above, but these figures do include a degree of water and space heating, which we can now treat separately.
Space heating and hot water: 7.0 kWh/d per household
With ambitious insulation levels and draught proofing ZCB suggests space heating demand can be reduced by 50%, space and water heating demand can then be supplied by heatpumps requiring an average of 7.0 kWh/d per household.
Electric vehicles: 5.4 kWh/d per household
The average household currently drives 7900 miles/year by car, which would require 5.4 kWh/d of electricity in an electric car. ZCB suggests that if we where to be really ambitious through increased car sharing, cycling & town planning we might reduce this to 6100 miles/year per household, 4.2 kWh/d per household.
Given that North Wales is a rural area its might be the case that average household mileage is significantly higher than other areas which would be something to look at in more detail.
Total: 15.7 kWh/d per household
Household electricity might therefore increase to 15.7 kWh/d per household from a present average of 11.4 kWh/d, an increase of 38%. This is probably on the optimistic end given energy the efficiency assumptions but at the same time its not necessarily inconceivable – if there was a consensus for lowering demand vs increasing supply.
Electricity demand might then look something like this (assuming no change in non-domestic demand), GWh
| Gwynedd | Anglesey | Conwy | |
|---|---|---|---|
| Domesic 2016 | 253 | 151 | 203 |
| Domesic ZCB | 332 | 190 | 307 |
| Non-domestic | 288 | 145 | 192 |
| Total | 620 | 335 | 499 |
Total demand 1454 GWh up from 1230 GWh (overall increase 18%).
Including Conwy’s offshore wind renewable energy would now supply 155% of demand. Without Conwy’s offshore wind it would be 28%.
-
How much of the North Wales coast offshore wind farm output can we claim for our own use? The wind farm is owned by RWE Innogy 50%, Munich city 30%, Siemens 10% and UK investment bank 10%. There is some debate as to who can claim the renewable energy benefits: Could Munich prevent the UK from meeting its renewable energy targets?
- How much more renewable energy do we need in Gwynedd, Anglesey and Conwy?
Sources
Renewable electricity by local authority
https://www.gov.uk/government/statistics/regional-renewable-statistics
https://www.gov.uk/government/uploads/system/uploads/attachment_data/file/647782/Renewable_electricity_by_local_authority_2014-2016.xlsx
Sub-national electricity consumption data
https://www.gov.uk/government/collections/sub-national-electricity-consumption-data
UK wide renewable summary
https://www.gov.uk/government/uploads/system/uploads/attachment_data/file/622799/Renewables.pdf
*The only adjustment made to the data above is to include the Parciau solar farm in the Gwynedd solar capacity totals above and beyond 2016 end data.
For more on the ZeroCarbonBritain scenario see:
http://zerocarbonbritain.org/
My work as part of OpenEnergyMonitor on understanding and summarising their scenario here:
https://learn.openenergymonitor.org/sustainable-energy/energy/introduction
https://learn.openenergymonitor.org/sustainable-energy/energy/energy-101
https://learn.openenergymonitor.org/sustainable-energy/energy/scenarios