Monitoring
As you might expect being a co-founder of OpenEnergyMonitor, I've been doing a lot of monitoring of our house to feed into the process discussed in the other posts in this series. This monitoring has three main goals:
Thermal performance monitoring
I've used a SAP based MyHomeEnergyPlanner household assessment and room-by-room heat loss calculations to build up a theoretical picture of the thermal performance of our house. A key output of this process is a total value for the heat loss rate in Watts per Kelvin (W/K) for the building fabric, including ventilation and infiltration. This value is usefully independent of how warm we choose to heat the house and factors such as the heating system or gains from electricity consumption, it reflects just the performance of the fabric.
Obviously, with any theoretical model it's accuracy is dependent on the inputs, estimating U-values and air-tightness rates can be a source of quite a bit of error, so can differences in internal temperature when calculating annual heat demand. These errors can of course have a significant effect on payback calculations for retrofit and heating decisions. Being able to cross-check with measured performance could be a useful way of reducing this error.
By monitoring internal temperature, external temperature, heat input from the heating system, heat gains from electrical consumption (lighting, appliances and cooking) and approximate values for solar gains (perhaps by using solar pv data as a proxy), it should be possible to apply the calculations used in the SAP assessment in reverse in order to calculate a measured value for the building fabric heat loss rate.
I was keen to design the monitoring system to collect the data required to test this process and make this a replicable process that others can use.
Heat pump performance monitoring
With the heat pump installed another goal of the monitoring system is to measure the performance of the heat pump, in particular what is called the coefficient of performance (COP), a measure of the amount of heating energy provided by the heat pump divided by the electricity consumed. I also wanted to be able to keep on eye on flow and return temperatures and how often the system might be cycling.
Octopus Agile costs for different electrical loads.
We have recently switched to the Octopus Agile time of use tariff, which is looking much cheaper than our previous tariffs.
In addition to the whole house measurement provided by the Octopus smart meter, using our OpenEnergyMonitor sub-circuit monitoring, it’s possible to explore the cost of different components of electricity consumption.
The cost of the electricity for different loads is different depending on what times of the day they run. An electric vehicle charging at night will enjoy the lowest average cost, whilst traditional lighting and cooking used at peak times will be the most expensive.
I’m particularly interested in the average heat pump electricity unit cost as this divided by the COP will determine the cost of the delivered heat. Can I beat the unit cost of mains gas?
Monitoring Hardware
The following picture gives an overview of the monitoring hardware involved:
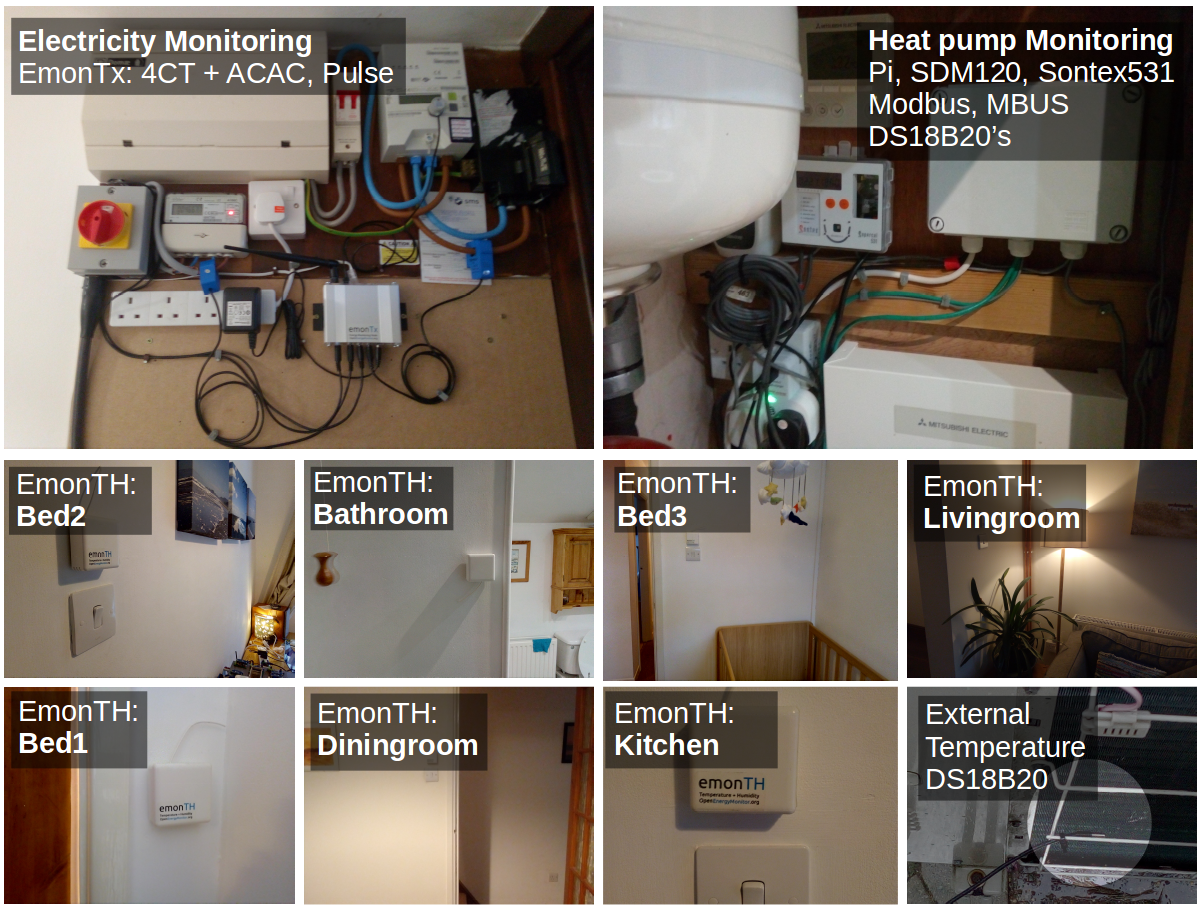
-
The main electricity monitor is an EmonTx with four clip-on CT sensors to measure consumption on different electrical circuits. I have CT1 monitoring whole house consumption, CT2 monitoring the EV charger, CT3 monitoring the heat pump & CT4 monitoring the fixed lighting circuit. The EmonTx also measures AC voltage to give a more accurate real-power reading.
See the OpenEnergyMonitor emonTx and emonBase guide for more information on the EmonTx and how to install and setup this part of the system. -
There are 7x EmonTH room temperature and humidity nodes, used to measure the internal temperature.
See OpenEnergyMonitor emonTH Guide for more information on the emonTH temperature and humidity nodes. - The heat pump monitor doubles as the monitoring system base-station. It is an emonBase with a MBUS reader to read from the heat meter, modbus reader to read from the dedicated SDM120 single phase electricity meter, DS18B20 one-wire temperature sensors wired directly to the emonBase RaspberryPi to read cylinder and outside temperatures and a RFM69Pi radio receiver module to receive the data from the emonTx and emonTH monitoring nodes.
See OpenEnergyMonitor Heat pump Monitoring Guide for more information on setting up a heat pump monitor and choosing the right components for your system
The following is my monitoring system as it currently stands.
See further down for a reduced set looking at reducing this overall cost.
Note: All costs are including VAT
| Quantity | Unit Cost | Cost | |||
|---|---|---|---|---|---|
| EmonTx v3 | Guide | OEM Shop | 1 | £59.40 | £59.40 |
| -- CT sensors | Learn | OEM Shop | 4 | £9.60 | £38.40 |
| -- AC-AC adapter (voltage sensor) | Learn | OEM Shop | 1 | £10.67 | £10.67 |
| EmonTH Temperature and Humidity nodes | Guide | OEM Shop | 7 | £37.56 | £262.92 |
| Heat Pump monitor & base-station | Guide | ||||
| -- EmonBase (inc SD card, Power Supply) | Guide | OEM Shop | 1 | £75.78 | £75.78 |
| -- DS18B20 Temperature Sensors | Guide | OEM Shop | 3 | £6.50 | £19.50 |
| -- RS485 Modbus reader | Guide | Amazon | 1 | £4.00 | £4.00 |
| -- MBUS to UART reader (inc USB to UART & cable) | Guide | OEM Shop | 1 | £36.26 | £36.26 |
| -- SDM120-Modbus single phase meter | JW Smart Meters | 1 | £42.00 * | £42.00 | |
| -- Sontex 531 MID Heat meter | Sontex | 1 | £273.60 | £273.60 | |
| Total | £822.53 |
That all came out higher than I was expecting. To make this more replicable it would be good bring these costs down.
Here are a few initial options for reducing this cost, with currently available hardware (but still meeting all the main monitoring goals):
- I've started here with 7x EmonTH temperature and humidity nodes but Im not sure how many are really needed to reach a sufficiently accurate mean internal temperature reading. A quick look suggests we could get mostly the same readings with 3-4 units. If three is sufficient this would save £150.24
- There are a number of MBUS heat meters that are a bit cheaper than the one that I have installed. The Sontex Superstatic 749 is ~£204, saving £69.00, or alternatively the Qalcosonic E3 is £179.10 (inc VAT), which would save £94.50. Both have MBUS capability. Im currently looking into the Qalcosonic E3 thanks to Richard Boyd at YouGenerate.
- Use the CT from the EmonTx for heat pump electric monitoring instead of SDM120, saving £42 + £4. I've used the SDM120 here as I wanted to ensure that I had Measuring Instruments Directive (MID) metering on both the electricity supply and heat output from the heat pump but it is duplication of monitoring provided by the EmonTx CT.
- The CT on the lighting circuit was just an addition for interest and not necessarily needed for the monitoring goals, saving £9.60
- Total cost: £522 (of which £343 of OpenEnergyMonitor monitoring and £179 for the heat meter).
The next version of the MBUS reader should reduce the cost of this part from ~£36 to ~£19 by removing the need for the seperate USB to UART adapter alongside a simplification of the design. We are also working on other hardware changes that could reduce costs further.
Alternative configurations
With an eye to wider replicability of the thermal performance monitoring goal in particular, the rollout of smart meters for both electric and gas could make this type of monitoring more accessible to a greater number of households.
-
Using the smart meter: Octopus provide a great API to access smart meter data, if you don't have an EV and a heat pump and all of the electrical consumption measured by the smart meter is inside the house you could use this data for the lighting, appliances and cooking gains for the thermal performance calculation. This would remove the need for the emonTx in doing the long term thermal performance monitoring. It's worth noting that this approach looses the real-time data made possible with the emonTx, but depending on your goals this may not be needed.
-
Anther approach without the emonTx would be to use the smart meter, an SDM120 single phase meter on the heat pump and the internal monitoring on the EV charger (if applicable) in order to work out the lighting, appliances and cooking contribution. Again this approach looses the real-time data made possible with the emonTx.
- If you have mains gas and a smart meter, and are with Octopus (or an other supplier with a good API for accessing the data) you could use this data to estimate the heat input into the house. In this case you may only need internal and external temperature monitoring in addition to the smart meter readings.
Software
Im logging all the data from the sensors above locally on the combined heat pump monitor / emonBase base-station. The data is stored on the SD card (currently 16GB). Over the last 3 years I've amassed 515Mb of data (with 70 feeds), which leaves plenty of space for long term logging on the SD card.
Running on the RaspberryPi is a software stack for processing, logging and visualising the monitoring data. The main application is called EmonCMS which is the software that I mainly work on at OpenEnergyMonitor. This application is accessible locally through your computers web browser, it's much like interacting with a web site on the web but its all running from the little box inside your home. It's also possible to provide remote access when your out and about using services such as dataplicity.
We do also provide an online version of this software running on Emoncms.org but I would recommend considering local storage using an emonBase, especially if you are installing the system in your own home. The cost is lower for more complex monitoring system's and you have a bit more flexibility and different software modules available.
Emoncms basics
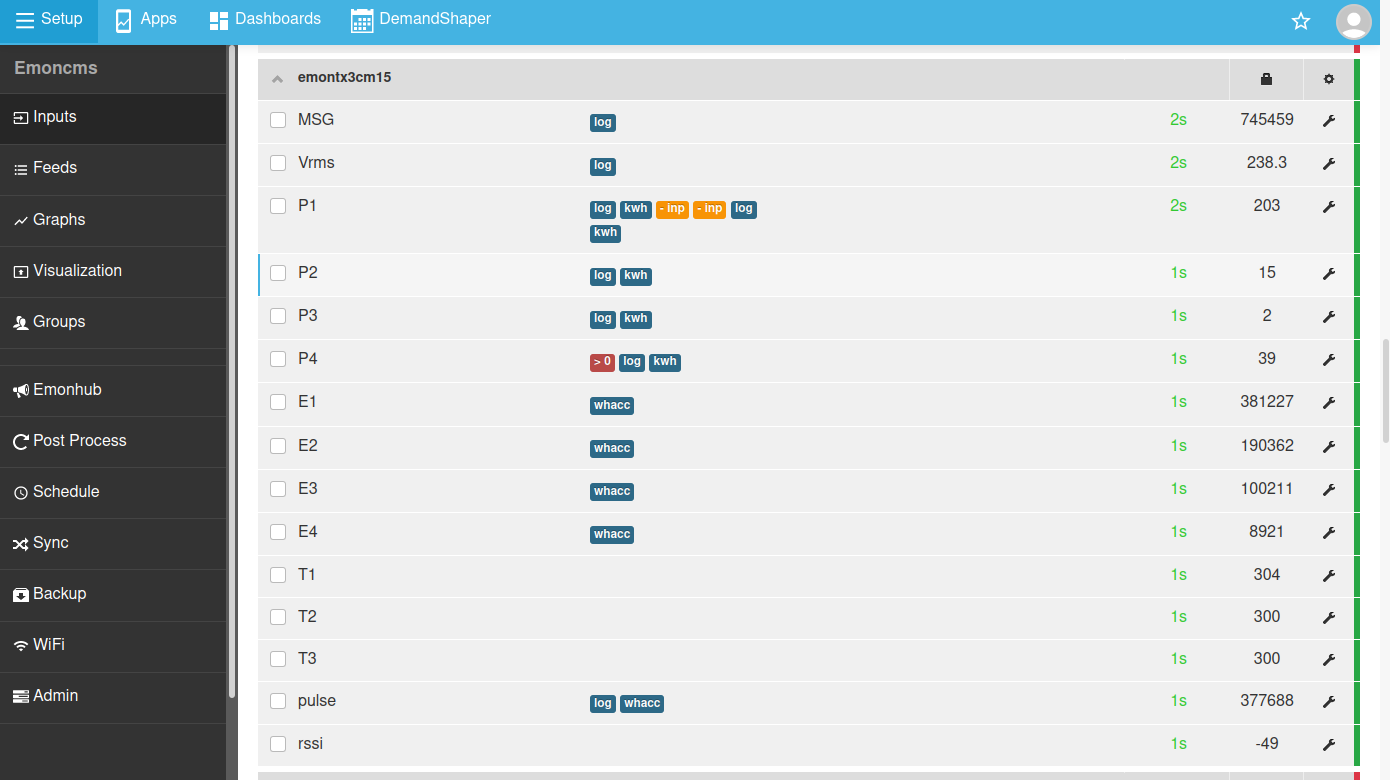
Data from sensors first appear on the inputs page, inputs can be configured with input processing to calculate values such as kWh data from power data, or to calculate lighting, appliances and cooking electricity demand by subtracting other loads from total household consumption.
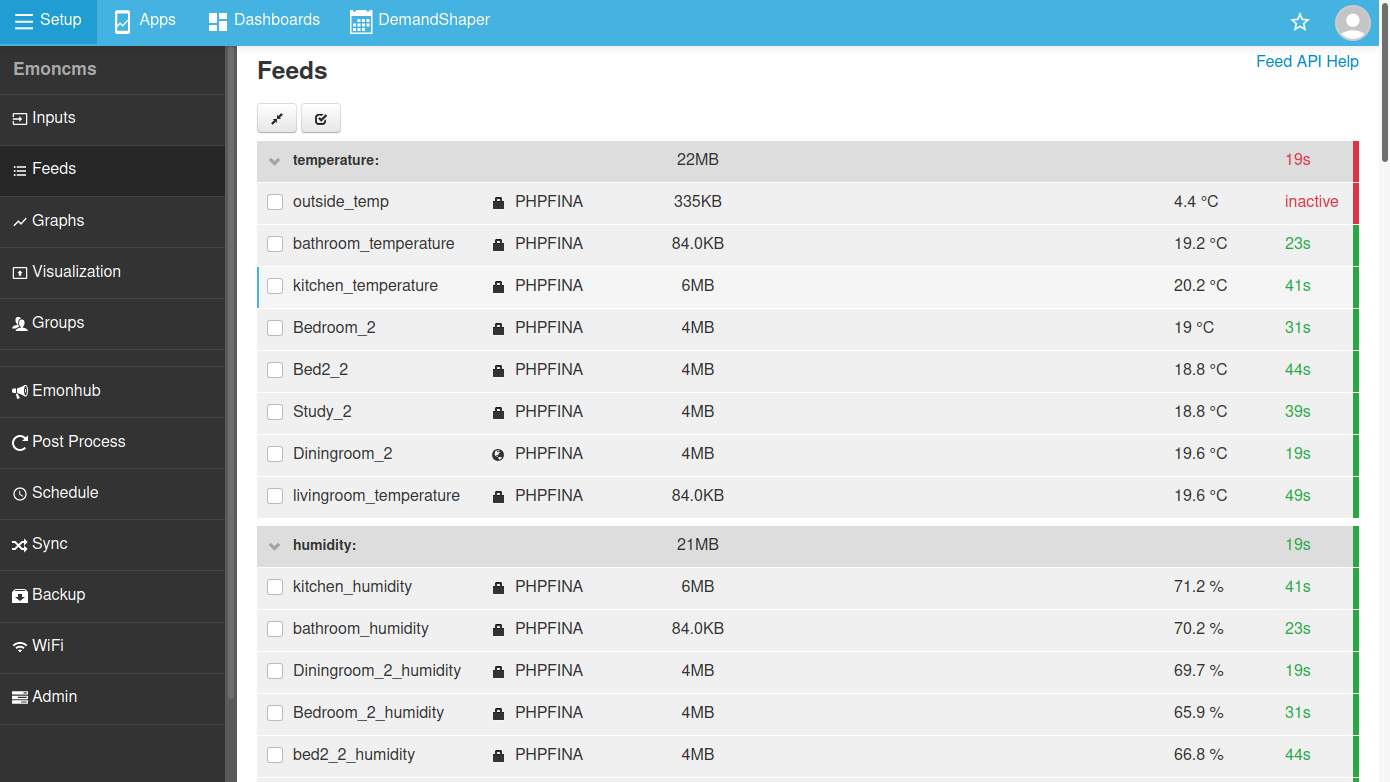
Feeds are individual time-series that are recorded to the SD card. These are typically recorded at a fixed interval such as 10s, 60s or half hourly data.
Emoncms provides a number of different ways to visualise and analyse data. The graph module links through to the feeds page giving a quick way to view the recorded time series data. Other options include dedicated app's such as the heat pump and agile dashboards featured below.
Useful Guides: Core concepts, Log locally, Graphs
Thermal Performance Monitoring
For the last couple of years I've been doing the thermal performance calculations manually in a separate spreadsheet.
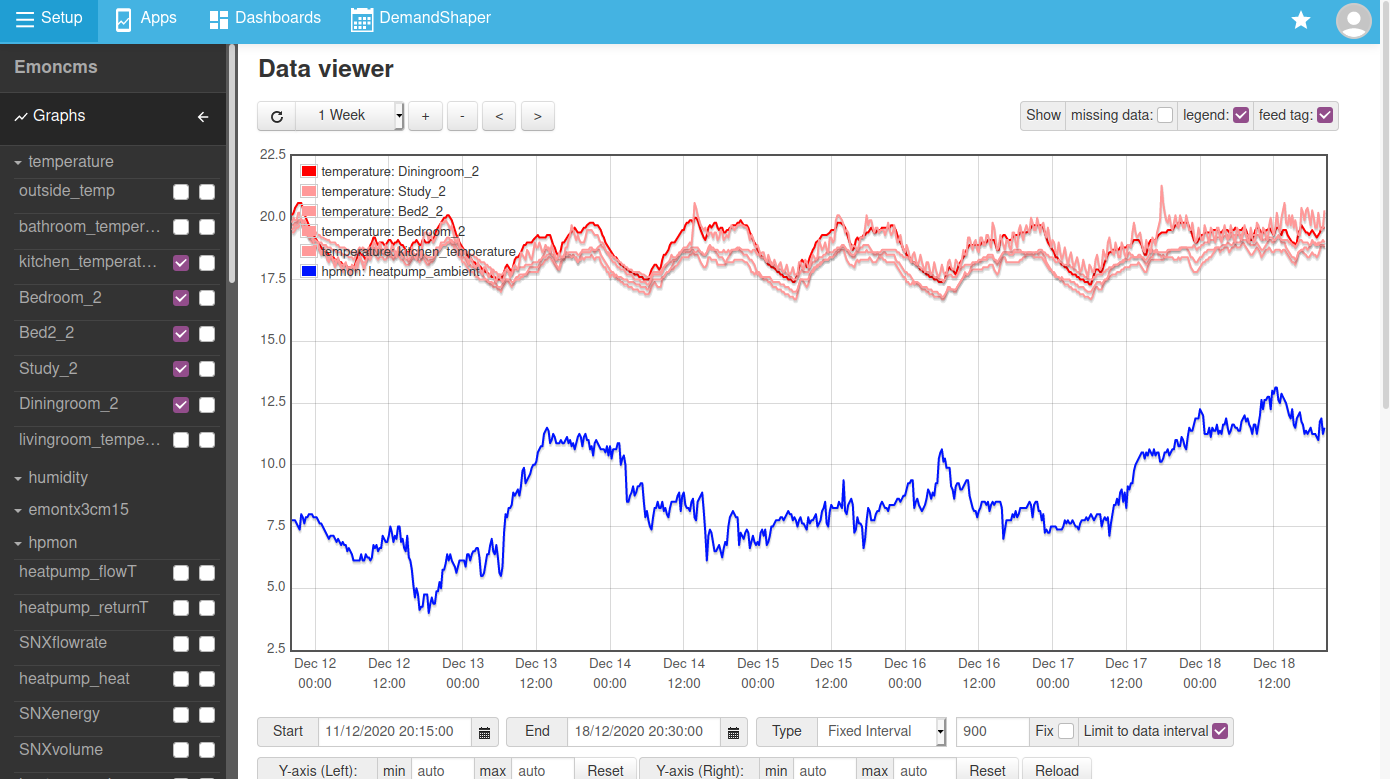
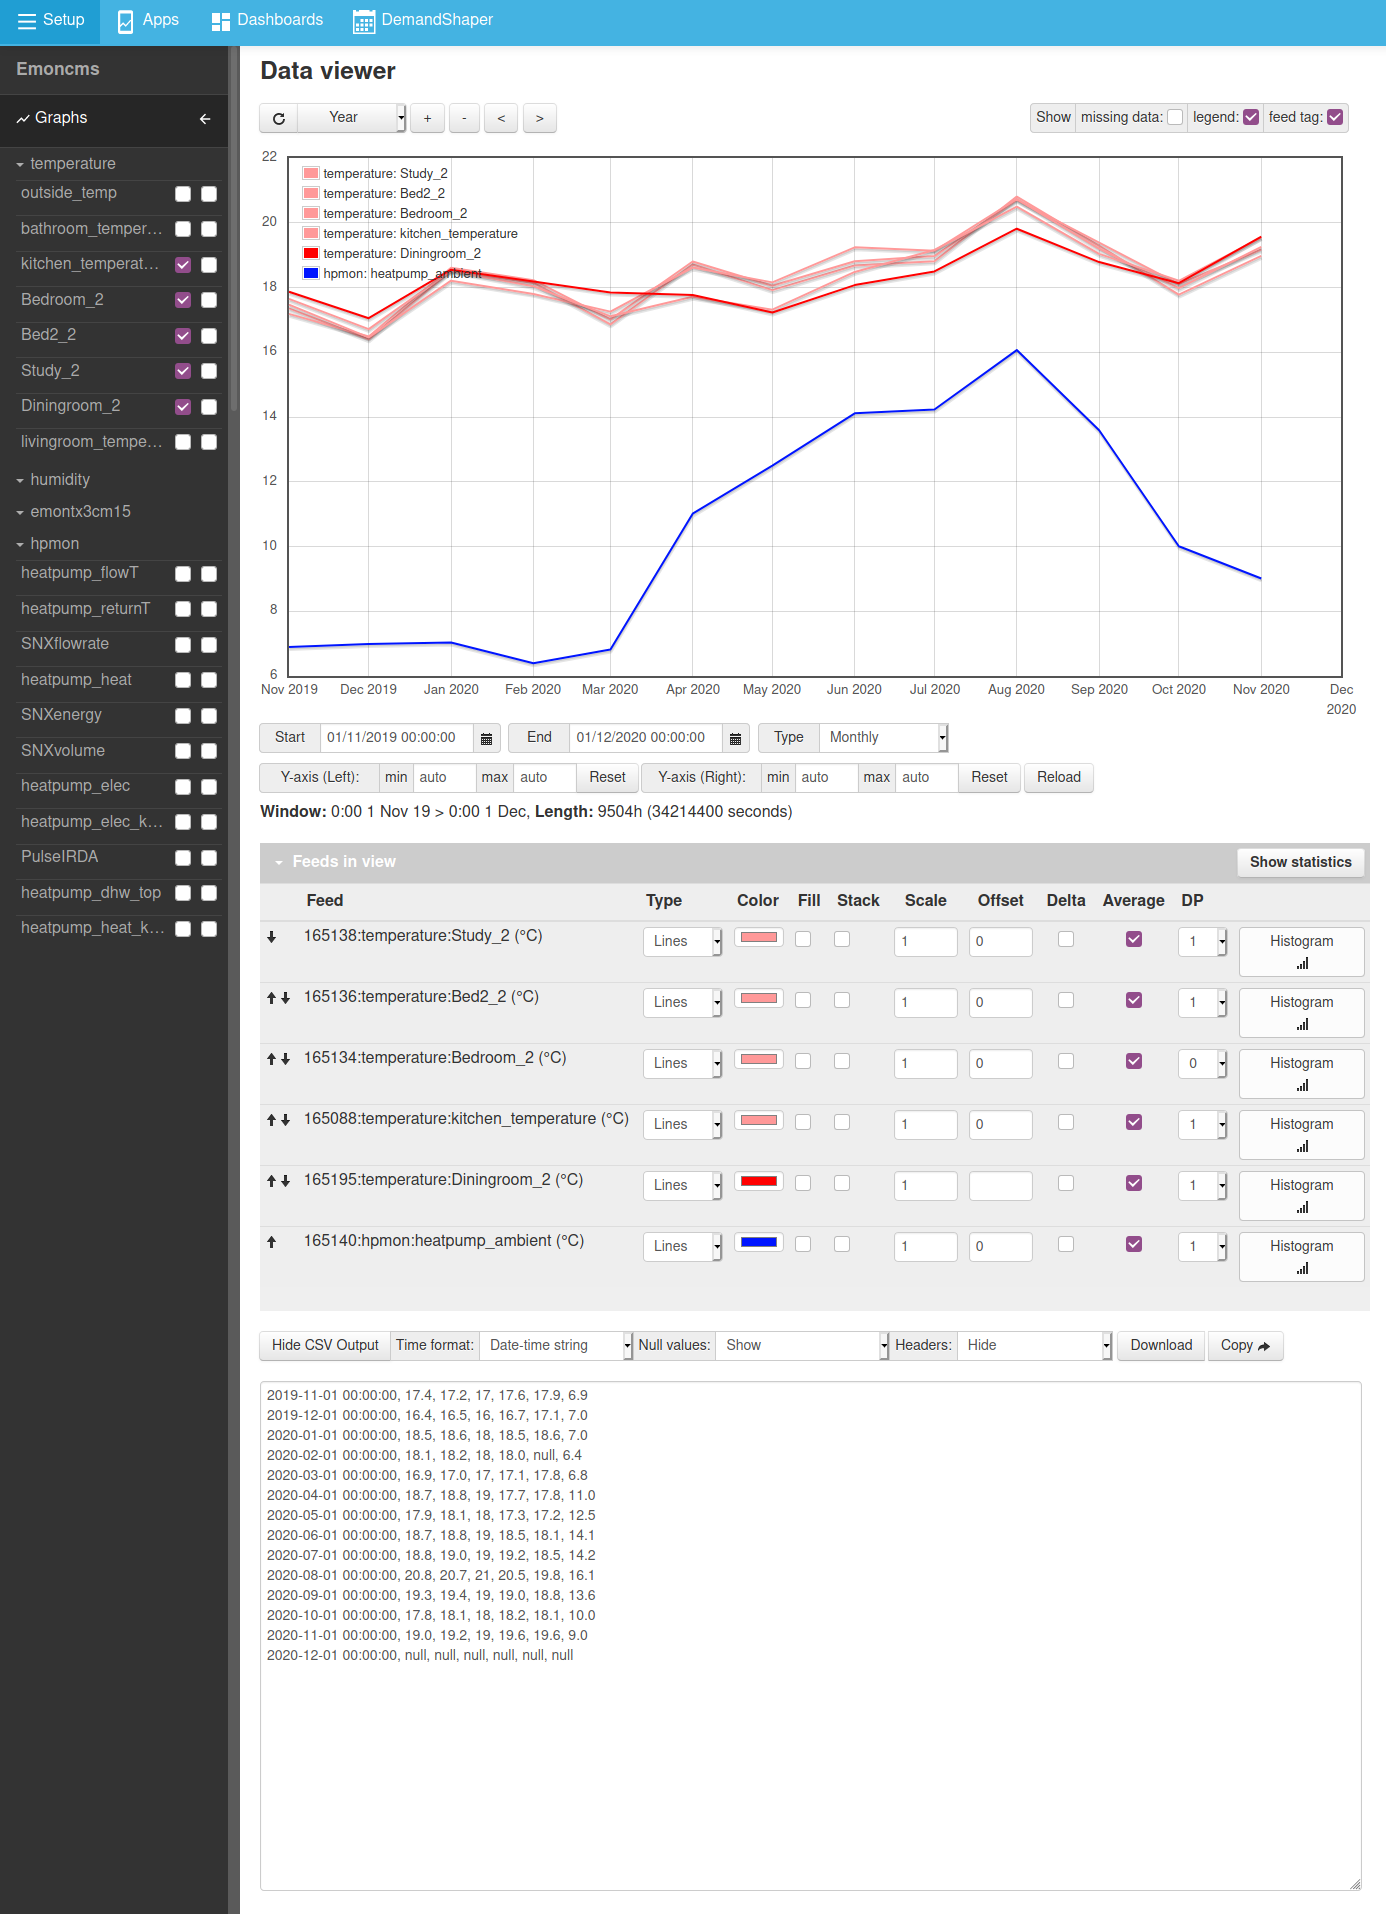
I would start by using the EmonCMS graph interface to calculate average monthly values for the different internal and external temperature sensors, and different sources of heat gain following the steps documented here Calculating Averages.
Then using the graph interface CSV export tool I would copy the monthly average values across to the spreadsheet for further calculation.
In the spreadsheet I would combine the different room temperature sensors with a weighting by floor area to give a set of monthly mean internal temperature values.
I would then subtract the mean internal temperature from the outside temperature for each month, giving the delta T between the inside and outside.
Then I would assemble all the different contributors to heat gain in the house on a monthly basis including: heating from the heat pump, utilised heat from domestic hot water (assumed ~50%), heat gains from lighting, appliances and cooking, measured as their electrical consumption all of which will ultimately be converted to heat. A manual estimate for metabolic gains (body heat) and a proxy for solar gains based on data from a near-by domestic solar PV system.
The heat loss factor is then given by the total heat input every month divided by the difference in temperature between the inside and the outside temperature.
An example of this spreadsheet is shown on the Heat pump: One year on blog post.
Approach 2: New Emoncms Heat loss rate calculation module
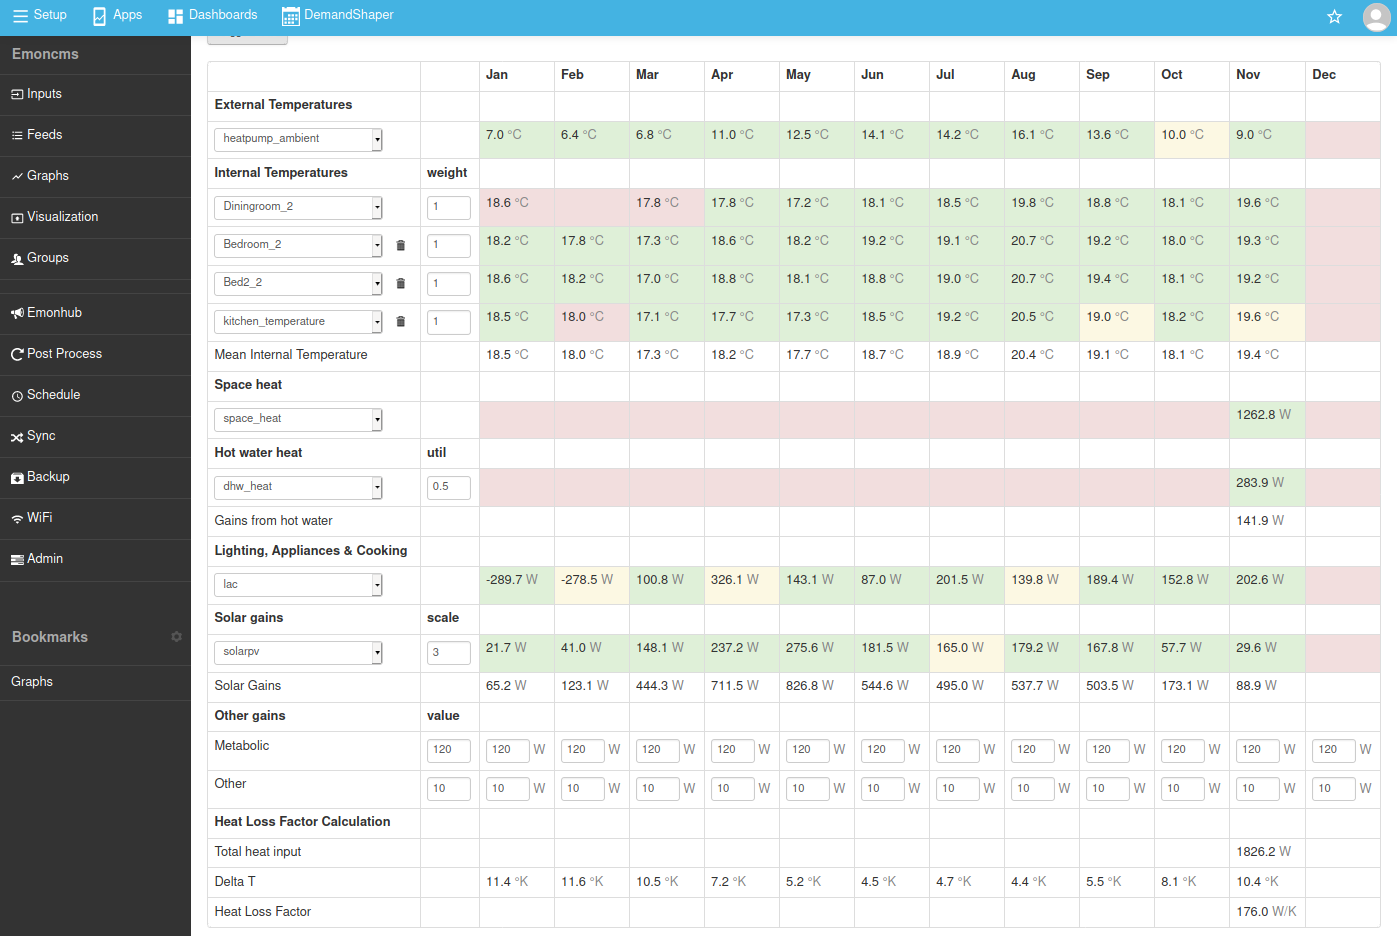
To try and make this process easier to replicate I've been working more recently on a tool built in to emoncms called sapcompare that assembles the monthly data and performs the heat loss factor calculation without having use a separate spreadsheet. This tool is available on github here. The screenshot below shows what this tool currently looks like.
The applicable feeds are selected using the drop-down selectors on the left hand side. The monthly boxes are colour coded according to how much data loss is present in that month. Hovering over each cell gives a tool-tip with the % of data present.
The intention is to expand this tool to integrate directly with the MyHomeEnergyPlanner assessment software in a way that makes it easy to compare the assessment calculation against the measured values.
Results: As discussed in the blog post on the heat pump one year on my heating energy consumption in the first year was 45% less than the amount predicted by the SAP based assessment. I think I can account for a large part of this being due to lower internal temperatures and higher external temperatures than those assumed in the assessment, but there is still around a 20% discrepancy remaining.
The assessment predicted the heat loss factor for the house to be 204 W/K. We can see from the above calculation for November that it suggests the measured heat loss factor to be ~174 W/K, which is 15% less than the assessment calculation. It looks like our building fabric or perhaps air-tightness is better than that assumed by SAP.
I would alternatively need to be missing about 295W of heat gain. Could I be gaining this kind of heat from my neighbours? Using the room-by-room heatloss calculator I can experiment with different temperature levels in the neighbouring properties, the difference in heat gain to our house with neighbours at 21C vs 18C average internal temperature is about 120W. (We would loose 12W if neighbours averaged 18C or gain 108W if neighbours averaged 21C, all very rough figures of course).
While its hard to say exactly what is the cause for the precise discrepancy between the assessment and the measured values we can see that they are in a similar ball park and that the heat loss looks to be in the direction of less rather than more.
Heat Pump Monitoring
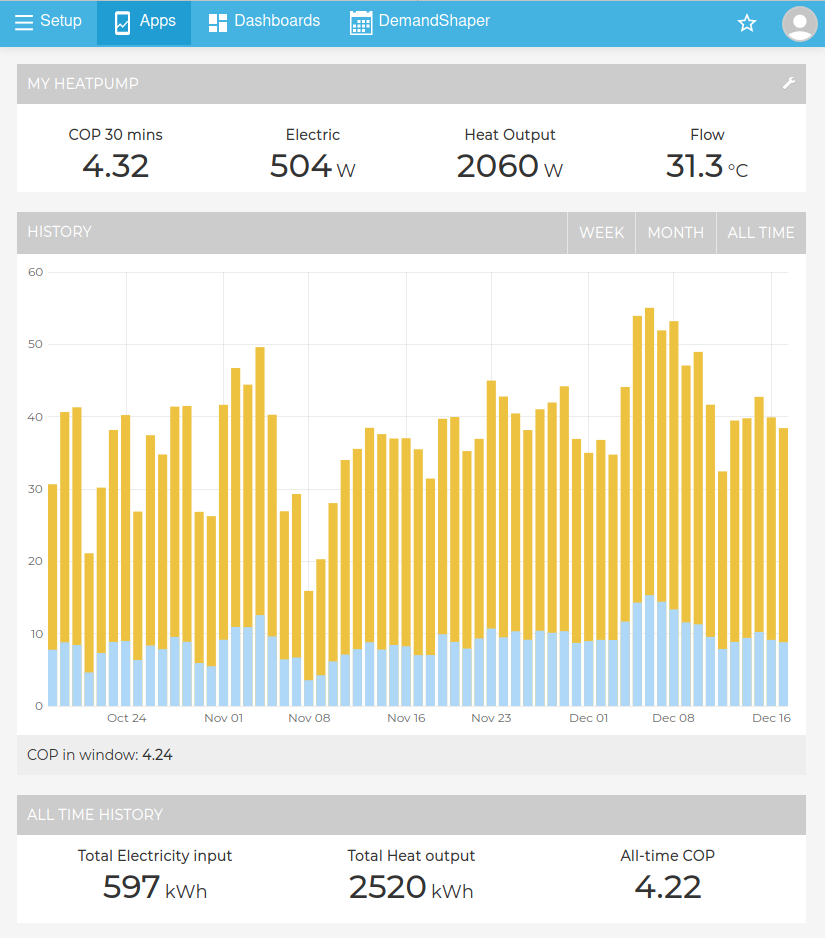
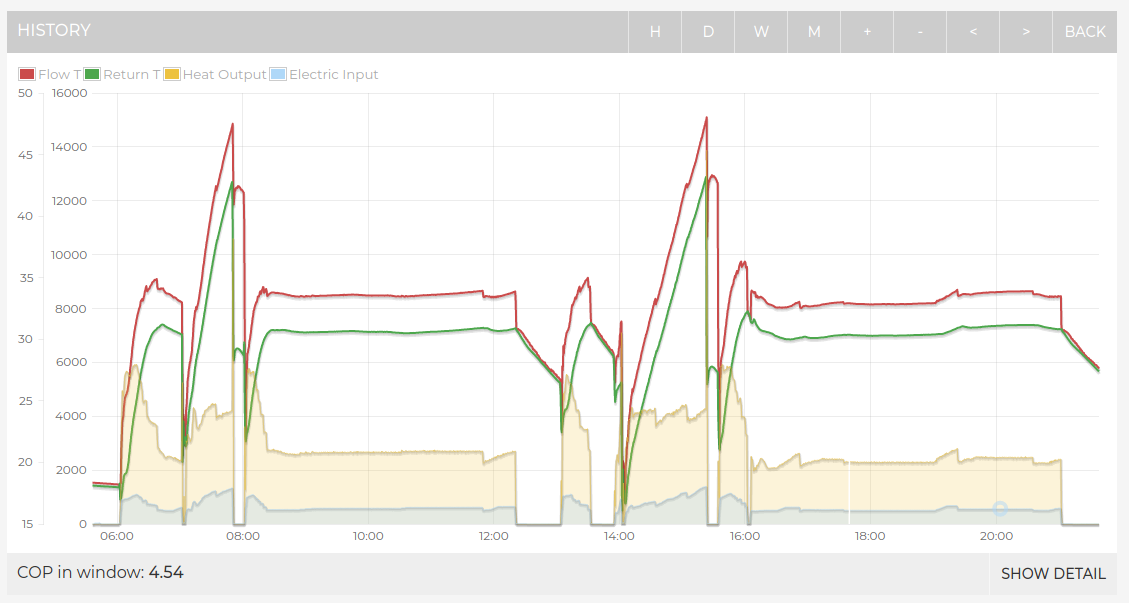
The main view is divided into three parts, at the top is the live status of the heat pump, the electrical consumption, heat output, COP and flow temperature.
Below that is the electricity input and heat energy output in kWh on a daily basis. Hovering over a given day shows the COP for that day.
The last box shows the all time total electricity consumption, heat output and COP.
The heat pump dashboard is probably the dashboard I check most often in emoncms. Just to check up on how the system is running.
I've recently started monitoring the space heat and hot water separately in addition to the combined readings. It's possible to create multiple instances of the heat pump monitor dashboard and select the separated feeds.
With this view you can check up on how the system temperatures are changing through the day and select specific sections to get the COP for that particular run period.
The example screenshot here shows the heating on most of the day and evening, with the flow temperature at 33C and 34C at different times for space heating. The two large temperature ramps, one starting at 7am and the other at 2pm is the hot water cylinder heat up.
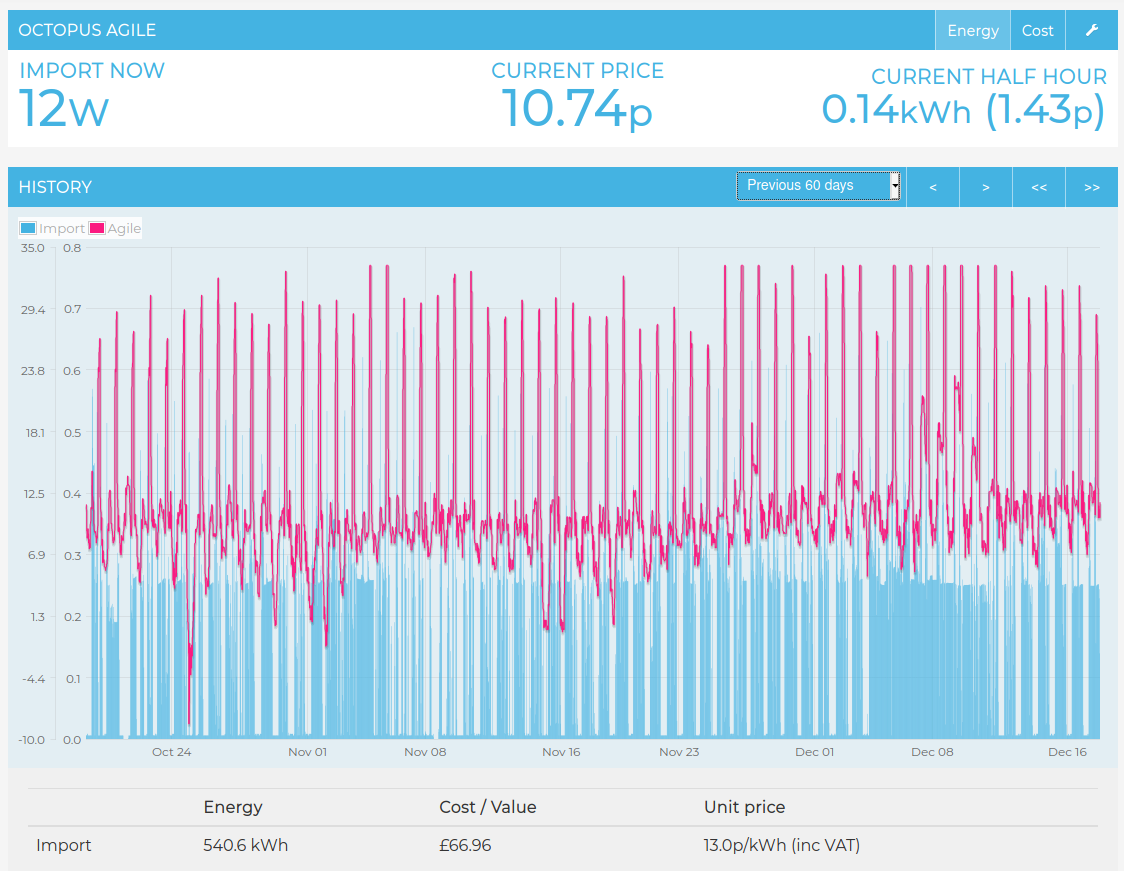
Octopus Agile Monitoring & Analysis
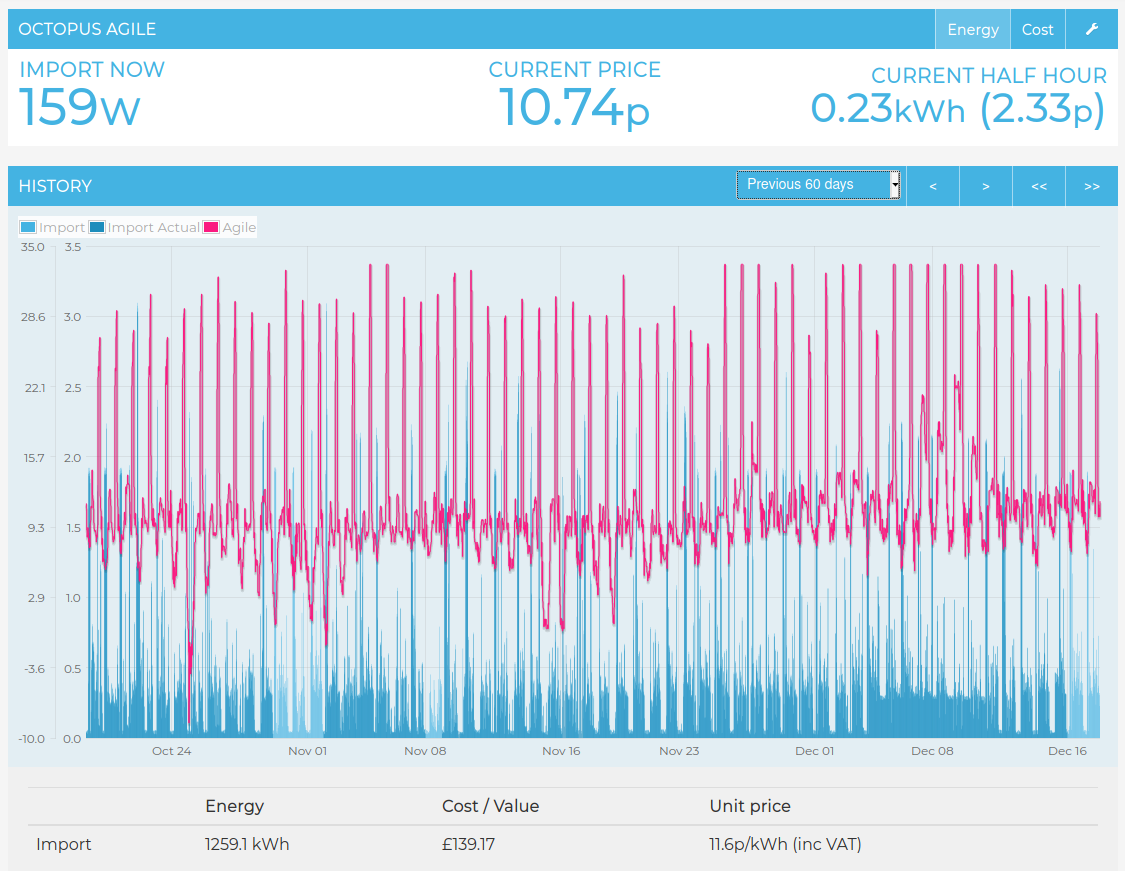
The dashboard makes it easy to work out how much you are spending and crucially what the average unit rate is.
See the guide here on how to set up this app: Octopus Agile Emoncms app.
The screenshot on the right shows our whole house consumption over a 60 day period. Our average unit rate was 11.6p/kWh which is 24% cheaper than the standard unit prices for our area and an amazing 40% less than the previous tariff that we were on.
For 2020 as a whole, our average unit rate was 9.8 p/kWh inc VAT.
One of the other really nice benefits of combining monitoring of different circuits in the home with an EmonTx and the Emoncms agile app is that its possible to easily work out the average agile unit rate of different loads.
For example an electric car charged at night at the cheapest hours of the day will have a much lower average unit rate than more traditional loads such as lighting, appliances and cooking. In 2020 our average unit rate for charging the car was 7.6 p/kWh, 22% lower than the average rate for the whole house.
At 7.6p/kWh, our per mile driving cost is 7.6 p/kWh / 3.8 miles/kWh = 2.0 p/mile! (I did pay more for the car than I would have paid for a petrol car and so this saving pays back that additional cost plus a little bit more).
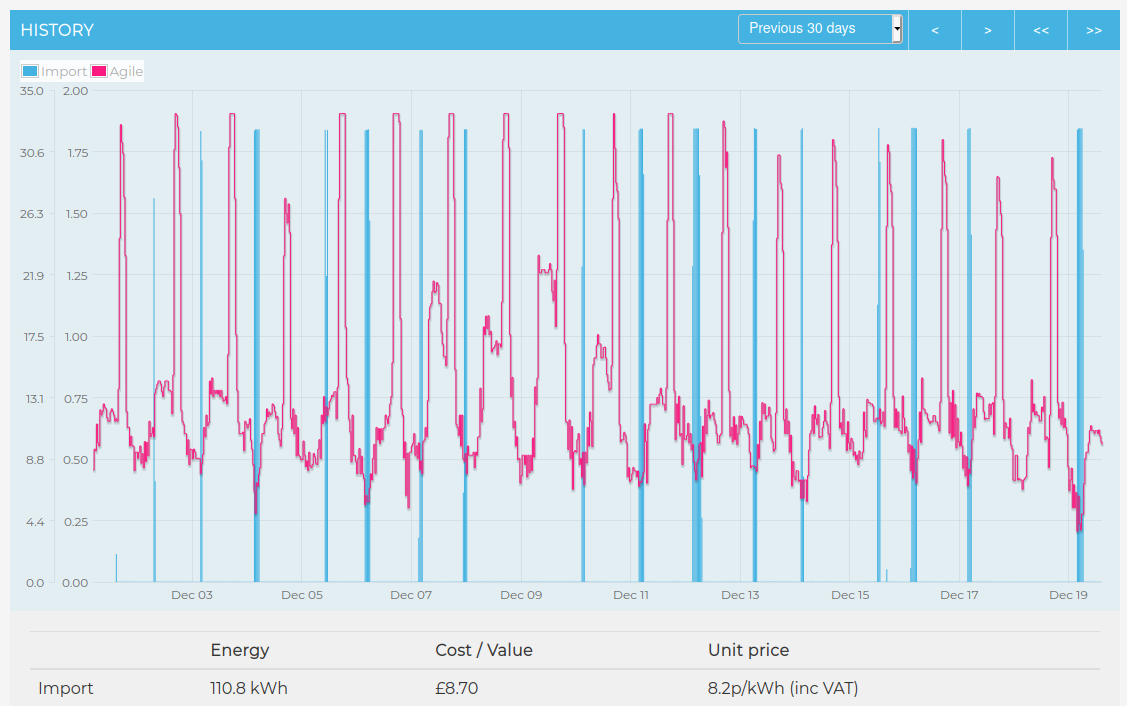
I can also look at the average unit price for the electricity used by the heat pump. Over the 60 days period in the screenshot the average unit price was 13.0p/kWh.
Using the heatpump dashboard I can then find the average COP for this period which was 4.25.
The average unit price of the delivered heat was therefore 3.06 p/kWh.
For the whole of 2020 the average unit price was 10.7 p/kWh and COP 3.91, delivering heat at 2.73 p/kWh.