Thermal Mass 2
Continuing from the previous post exploring thermal mass, there are two main questions I wish to gain insight into.
-
What is the implication of externally insulating high thermal mass walls such as stone walls on heat up times, approach to heating control: schedules or continuous heating. It makes sense that the heat-up time will be much slower than if the walls are internally insulated, and that the temperature will also be more stable, remaining higher for longer once heated. A higher temperature for longer should mean more energy is lost overall than if the house falls to a low temperature for extended periods of the day, is this significant? I would like to gain a better understanding of how the relationship between heating control approach and thermal mass affect overall heating demand.
- As discussed in the previous post, I would like to explore the potential of using the thermal mass in externally insulated stone walls for absorbing excess wind energy at times of low electricity demand in order to then reduce peak time electricity demand that would likely result form a large shift to electrified heating without such an approach.
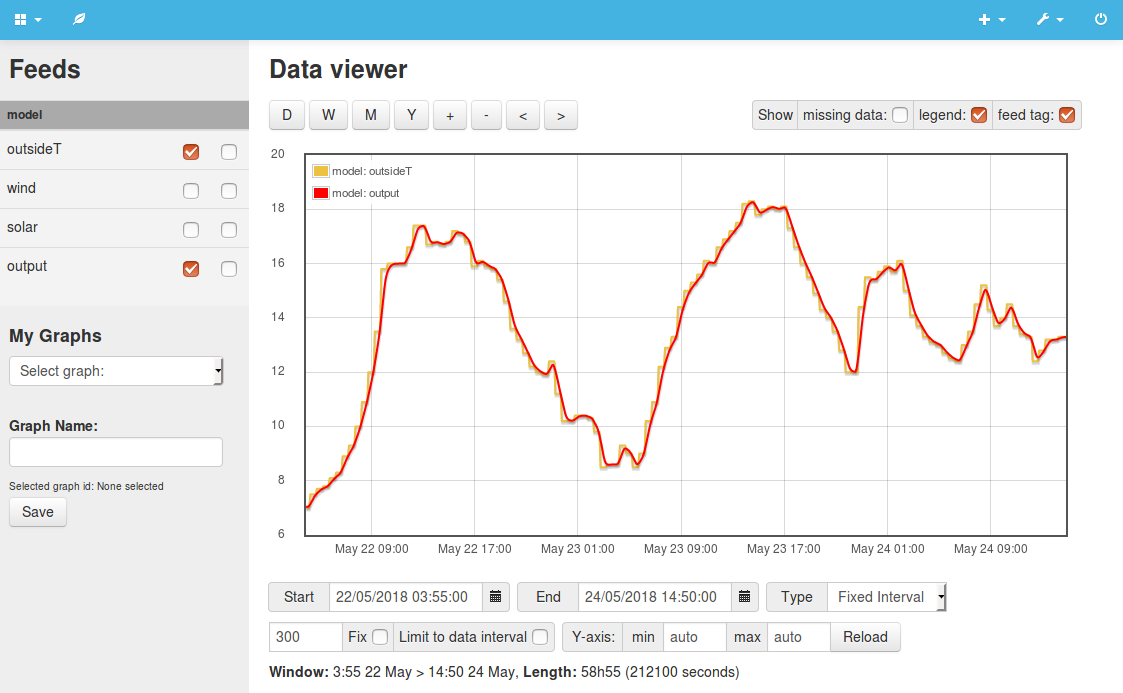
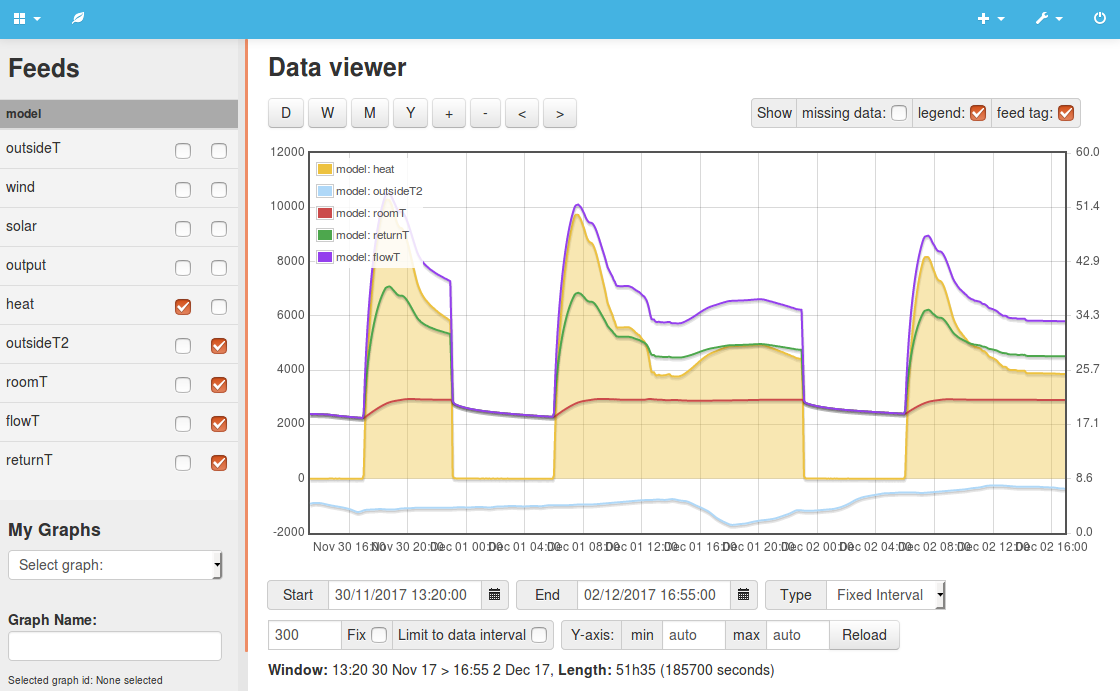
A number of years ago now I did some work developing a dynamic simulation of thermal mass in a simple building that showed promise. I was able to simulate the internal temperature from measured heat input and external temperature data. The following screenshot shows how closely the simulation matched measured temperature:
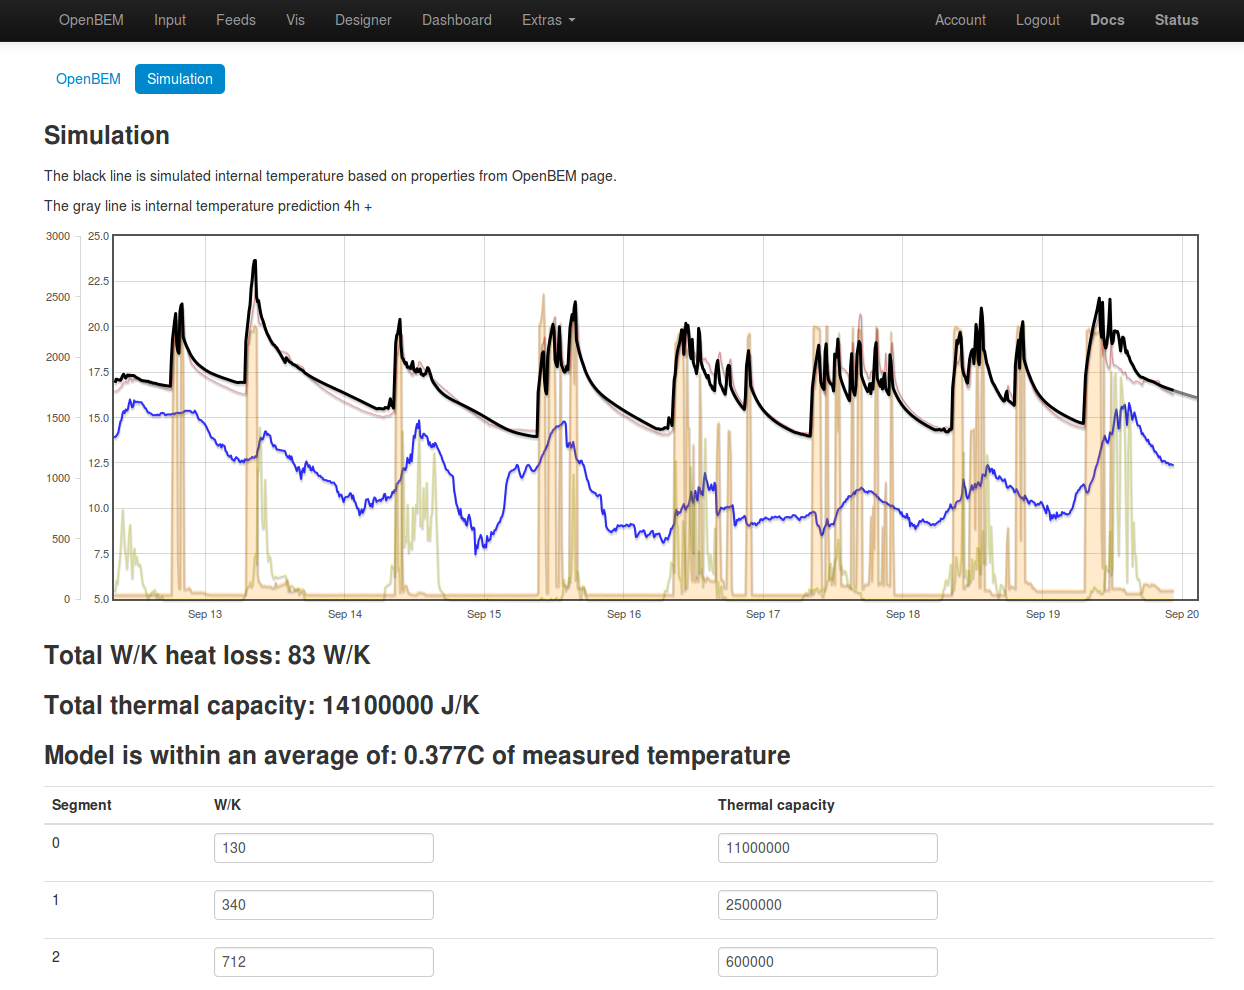
The model type was a multi stage resistor-capacitor model, using the resistor-capacitor analogy for thermal modelling is a standard approach used in many thermal models, there's an interesting page on it here: http://lpsa.swarthmore.edu/Systems/Thermal/SysThermalModel.html

But I did not manage to build on this model for more complex buildings, or fully relate the model parameters to the physical materials of the building, rather they where found by a process of trial and error until the simulated temperature provided a good match.
Last year while exploring the potential for self-consumption of solar pv I built another dynamic energy model but this time focusing on battery and hot water storage rather than building thermal mass. In order to avoid the work involved with writing a custom user interface I realised I could use the existing visualisation tools in emoncms and have a script first read input data from a number of emoncms feeds, run the model and then write the results to output feeds. These feeds could then be visualised using the emoncms graph module. It's a powerfull and relatively simple approach giving you full power to write your own dynamic simulations without having to rely on more complex pre-built tools apart from emoncms.
Emoncms is open source software, the source code and installation guide can be found here: https://github.com/emoncms/emoncms
The following series of examples applies this approach to a heating energy model, building the model up step by step, adding more complexity. Starting with how to load an external temperature feed dataset and ending with a model that covers: thermal mass and heat conductivity in an insulated building with a wind power modulated heat pump, solar and other gains.
Example 1: Reading an external temperature feedThe example loads an external temperature feed from emoncms which I had in turn downloaded from a local weather station on weather underground. The dataset is half hourly while the model timestep in the next series of examples is 60s. The ModelHelper class implements both linear interpolation and smoothing resulting in a higher resolution output temperature feed. Without this the heatpump model in later examples becomes unstable. View source code: 1.php |
 |
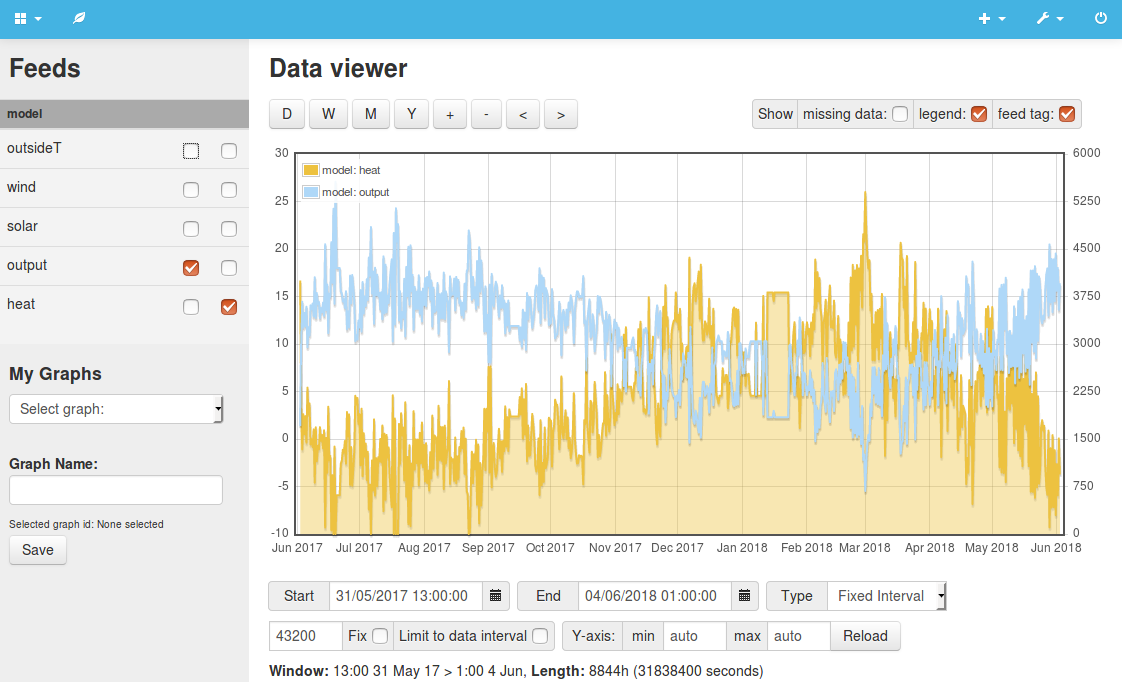
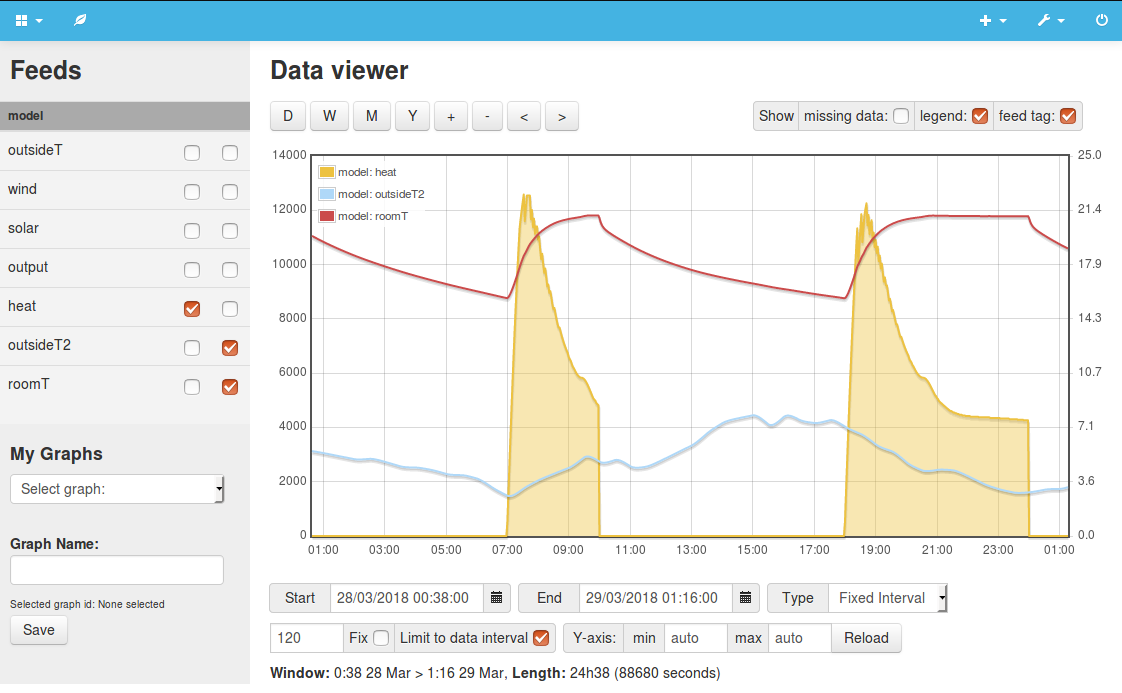
Example 2: Basic steady state heat lossNow we can add a basic state state heating model that calculates for every interval what the difference in temperature is between the outside temperature read in from the outside temperature dataset and a fixed inside temperature of 21C. Multiplying this by the building heat loss factor (here 204 W/K the heat loss factor as calculated by MyHomeEnergyPlanner for our terraced house) gives the heat required to maintain 21C. The screenshot on the right shows the resulting heat input (yellow) that is generated from the outside temperature feed (blue), visualised using the emoncms data viewer. The model prints at the end the average heat input and kWh required: Average heat input: 2226W (19,500 kWh) View source code: 2.php |
 |
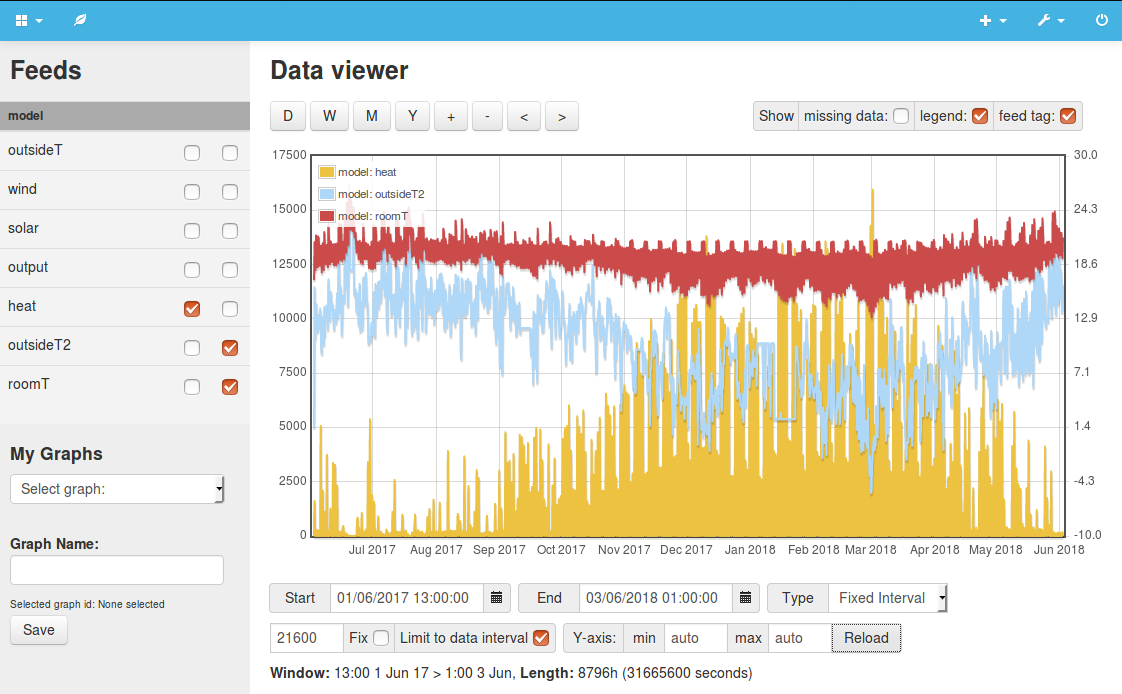
Example 3: External wall thermal mass modelFor this simulation we step it up a gear, introducing both a multi stage 'resistor-capacitor' model for the thermal mass and heat conductivity of the external walls, and a variable output heating algorithm. With both of these in place its possible to start exploring the effect of adding a heating schedule, leaving the building to drop in temperature when not occupied. A lower average temperature means a lower average heat loss rate. The following results show the effect of continuous versus intermittent heating on overall heat demand. Running the heating for 9 hours on weekdays and 17 hours on weekends which is 47% of the time results in a heating energy saving of 13.7%. The heating system needs to work extra hard to bring the temperature back up to the setpoint during the occupancy period hence the lower saving than the reduction in heating hours. Continuous heating, mean internal temperature 21.0C Heating schedule, mean internal temperature 19.5C View source code: 3.php |
|
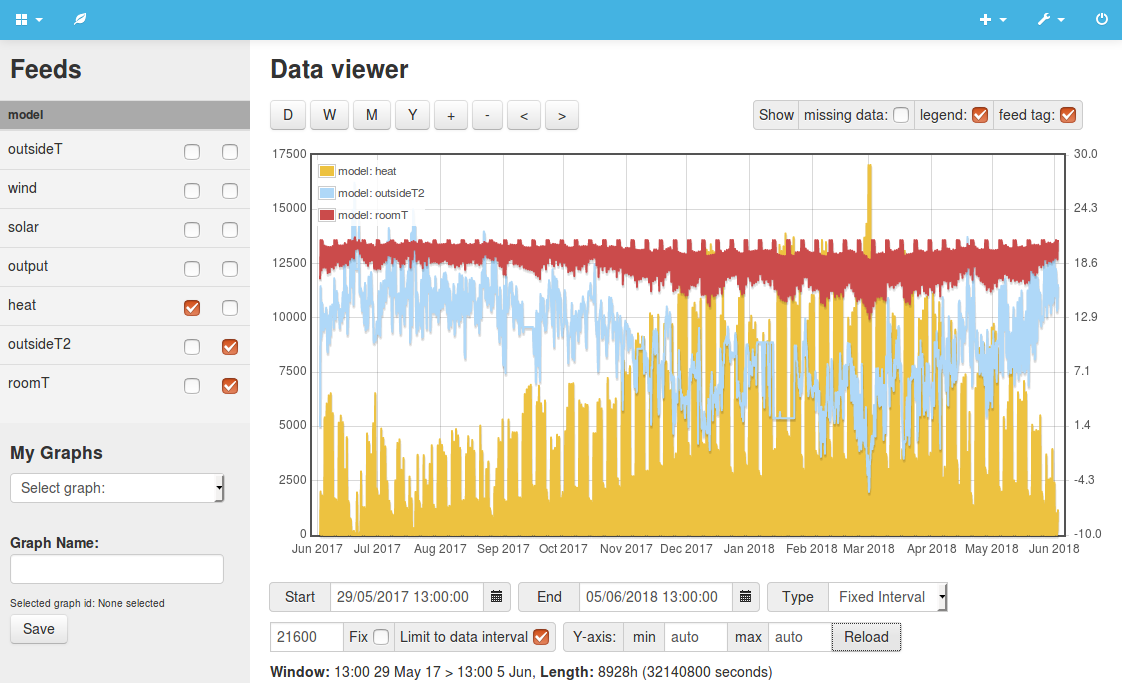
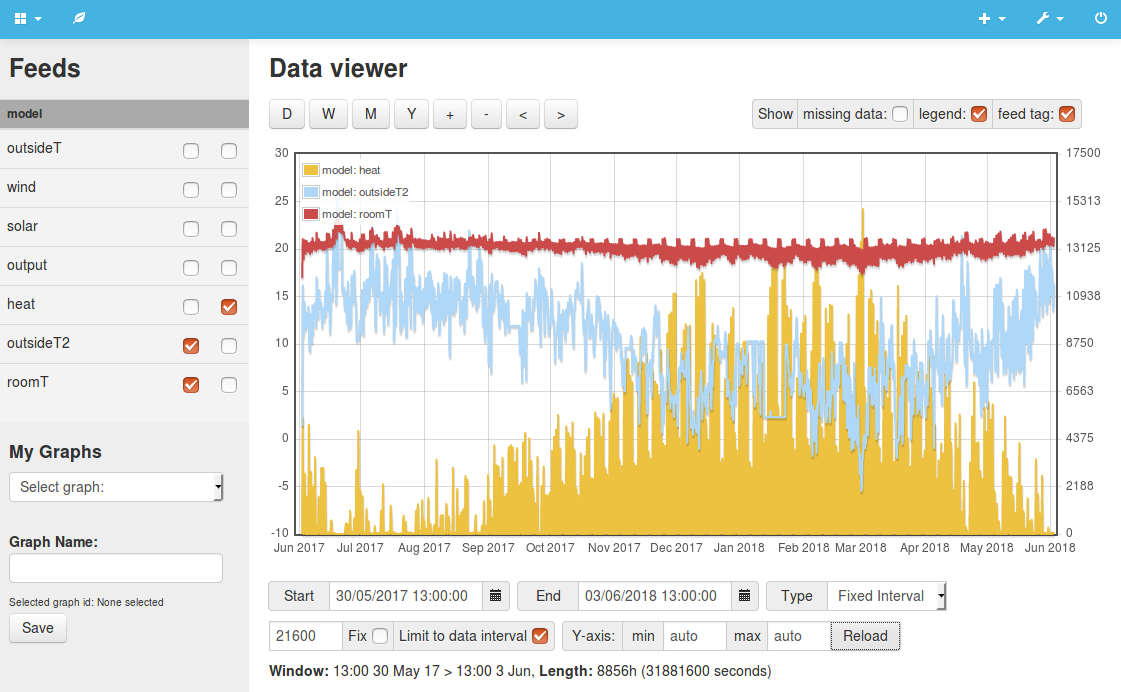
Example 4: Solar gainsThe examples so far have looked at total heat demand, in a real building a large part of this heat demand is provided by a number of gain sources including: solar gain, heat given off by lighting, appliances, cooking, hot water systems and even people and pets. This example adds solar gain to the model using high resolution solar PV output data as a proxy for solar intensity. The average solar gain per m2 for each orientation is calibrated against the average solar gains suggested in SAP, e.g 43.7 W/m2 for south facing windows with little shading. Looking at the average solar gains on a monthly basis shows a difference between the SAP values and the solar PV proxy values with the solar PV proxy values showing a greater swing with lower winter and higher summer averages - something I need to look into in more detail. The model also showed a little overheating in summer, to simulate the opening of windows, the air change rate is increased by 3 ACH when the internal temperature rises above 22C. Im not entirely sure what a realistic increase in ACH rate is by opening windows to reduce overheating - this also needs further work. Results so far bearing in mind the above questions: Continuous heating, mean internal temperature 21.1C Heating schedule, mean internal temperature 19.9C Lowest indoor temperature 13C at 6am, March 01 following night time set back and an outside temperature of -5C. These results show the effect of solar gains on reducing heating demand with a reduction of 3053 kWh in the continuous heating case and 2716 kWh in the heating schedule case. View source code: 4.php Gains from Lighting, Appliances, Cooking, Water heating and people provide about 580W or 5100 kWh of additional heat input in the MyHomeEnergyPlanner assessment. If we model this simply as a continuous heat source the heating energy demand falls to: Continuous heating, mean internal temperature 21.2C Heating schedule, mean internal temperature 20.3C These figures are now very close to the heating demand as predicted by the MyHomeEnergyPlanner model of 9714 kWh, a difference of 3.3%. |
|
Example 5: Party wall thermal massAnother large source of thermal mass in our terrace house will be the party walls which are solid stone construction. This example adds party wall thermal mass to the model, duplicating the multi stage resistor-capacitor model used for the external walls but this time with the external surface of the party wall being at the same temperature as the internal room temperature - assuming that our neighbours are heating to the exact same temperature. We can see in the screenshot on the right that the resulting temperature fluctuations are less. This time the minimum internal temperature reached with non continuous heating is 17.2C at 5pm on March 1st and the mean internal temperature is slightly higher at 20.4C. Continuous heating, mean internal temperature 21.1C Heating schedule, mean internal temperature 20.4C Heating schedule with simple LAC + DHW + Metabolic gains View source code: 5.php |
|
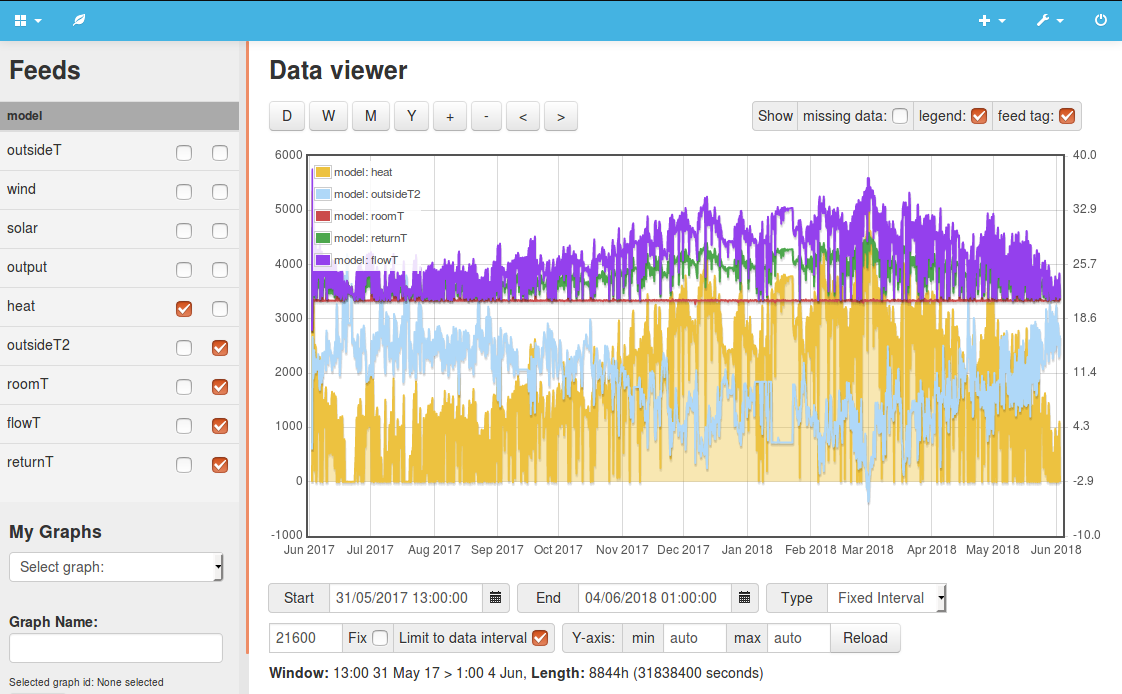
Example 6: Heatpump modelI would like to install a heatpump as the heating system to make is possible to use electricity from renewable energy to heat the house. This example adds a basic model of a heat pump and radiator heat emitters, following work I did earlier on this subject documented here. The model calculates the flow and return temperatures, inertia in the heating circuit and the COP of the heatpump based on the Carnot efficiency equation. Continuous heating, mean internal temperature 21.1C For intermittent heating a 4.8 kW heat pump is not sufficient, increasing the capacity to the next size up 8.5 kW and increasing the radiator output accordingly to 8.5 kW at deltaT 20K (28 kW at deltaT 50K) results in the following performance: Heating schedule, mean internal temperature 20.4C Had I kept the radiator output the same at 4.8kW the electricity consumption of the heatpump increases to 4421 kWh because the heatpump needs to drive higher flow temperatures to heat the house up prior to the heating periods. If we then run the larger system continuously, the performance is even better (because of the larger heat emitter area and possibility to run the flow temperatures even lower: Continuous heating, mean internal temperature 21.1C We could of course reduce the heat pump size back to 4.8 kW with the 28kW heat emitter capacity and maintain the same performance. Including lighting, appliances, cooking, hot water and metabolic gains as above with a 4.8 kW heat pump and 4.8 kW @ 20K heat emitter output results in the following heatpump electricity consumption:
Average heat input: 1294W (11,334 kWh) The model does not yet capture the performance loss due to system cycling and in warmer months is often running the theoretical heatpump below the minimum input power of the 4.8kW Mitsubushi EcoDan heat pump which results in higher COP's than would realistically be achievable. This needs further work. View source code: 6.php |
|
Example 7: Wind powered heating - part 1A key motivation for wanting to better to understand thermal mass is to look at the possibility of using thermal mass to store heat during times of excess wind supply to then reduce heating demand at times of low wind supply. This example limits the heatpump electrical input to the available wind supply in order to explore this possibility. The following results list three temperature drop levels and their corresponding wind capacity requirement. 3.0K drop, 18.0C minimum, 21C set point 2.0K drop, 19.0C minimum, 21C set point 1.1K drop, 19.9C minimum, 21C set point If all houses in the UK where uninsulated, leaky stone terrace houses with heatpumps we would need around 46 GW of wind capacity if a 3.0K drop was acceptable... the next example looks at improving the building fabric. View source code: 7.php |
|
Example 8: External insulation, air-tightness, improved glazing, heatpumps & wind powered heatingThis final example brings all the above parts together including passivhaus retrofit standards of building fabric improvement as explored in the retrofit scenario. With a high level of building fabric performance the heating demand and associated wind capacity required falls right down to perhaps surprisingly low levels! Our acceptable 2.0K drop in temperature in periods of low wind supply, a 19.0C minimum and 21C set point. Results in a maximum heat pump electrical input requirement of 153W and a corresponding maximum wind capacity of 158W.
Average heat input: 167W (1,462 kWh) If all houses in the UK where insulated and air-tight to this standard and with heatpumps, we would need around 4.1 GW of wind capacity if a 2.0K drop was acceptable. A 15x reduction compared to the non-insulated example, which really goes to show the energy saving potential and upstream benefit in terms of reduced wind and grid capacity of building fabric work. Switching to internal wall insulation on the external walls results in a minimum temperature of 18.4C for the same wind capacity, reflecting the effect of having less thermal mass available. Adding a 60mm layer of internal wall insulation to the party walls results in a minimum temperature of 14.9C, again indicating the effect of removing thermal mass and therefore the potential of thermal mass to hold heat over extended periods of time during times of low wind supply. The heat input requirements in this final model falls well below the minimum electric input power of even the smallest Mitsubushi EcoDan heatpump. Im not sure if its possible to get heatpumps with such small capacities. The heatpump would need to heat domestic hot water which would likely exceed the heating demand in this case and so the capacity would need to be larger than the space heating only capacity. This needs further work. View source code: 8.php |
|