Heat pump performance and home energy 2021
The main changes in 2021 were:
- Slightly warmer internal temperatures +0.15C more than 2020 and +1.11C more than 2019.
- Slightly colder outside temperatures -0.3C less than 2020.
- Increased electricity costs due to wholesale cost increases. Switch from Agile to Go tariff in August 2021.
It's difficult and perhaps a bit unfair to compare this unit cost with mains gas given that we were lucky to fix our electricity tariff on Octopus Go in August 2021 and also given the price rises across the board.
Heat pump performance overview
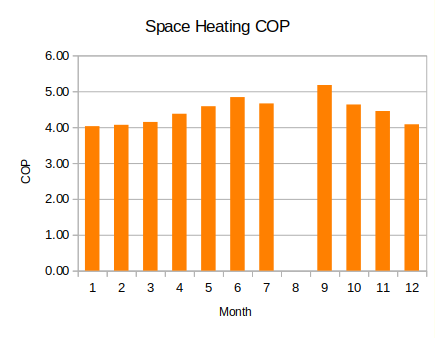
- Annual space heating COP average: 4.2
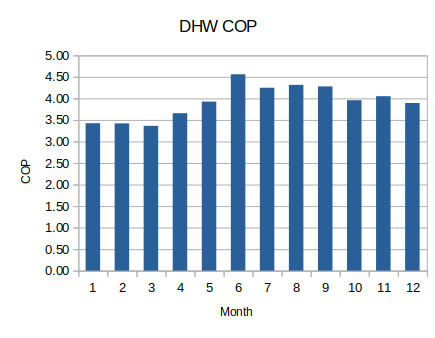
- Annual domestic hot water COP: 4.1
- Standby electricity consumption: 99.4 kWh
- Combined space heating and DHW COP (not including standby): 4.16
- Combined space heating, DHW and standby COP: 4.04
The following monthly COP figures for space heating and domestic hot water (DHW) are specifically for the periods of time that the heat pump is running. This shows higher COP's in the summer than the winter as we would expect given higher outside temperatures. The combined COP chart includes standby consumption and we can see that it drags down the summer COP's.
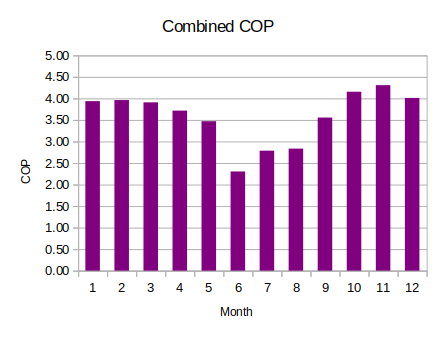
The average annual COP of 4.04 is very slightly higher than both 2019 and 2020 figures.
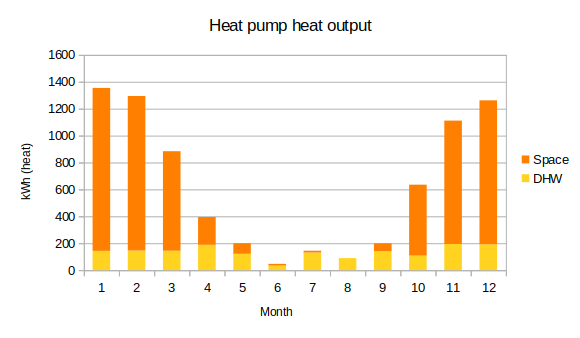
The following charts show the electricity consumption of the heat pump separated out again by space heating, hot water and standby. Standby consumption increases in summer as the heat pump spends a lot more hours on standby.

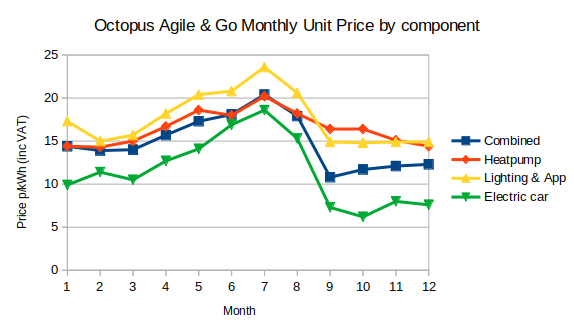
Octopus Agile & Go costs and Grid Carbon Intensity
- Total electricity cost of £906.15 for 6217 kWh (inc VAT)
(Coving all our standard electric, 100% of our heating and about 70% of our driving). - Annual average unit price for whole house: 14.6 p/kWh (inc VAT)
- Annual average unit price of electricity for the heat pump: 15.5 p/kWh (inc VAT)
- Annual average unit price for the electric car: 11.7 p/kWh (inc VAT)
- Annual average unit price for the lighting, appliances and cooking: 18.1 p/kWh (inc VAT)
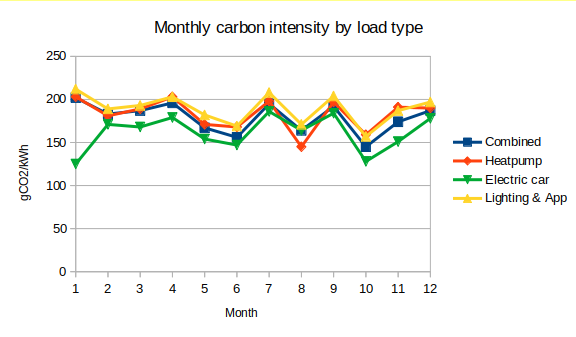
Again here we see that the overnight electric car charging has the lowest intensity whilst day time loads such as the heat pump and lighting etc is higher.
Annual averages:
- Combined: 179 gCO2/kWh
- Heat pump electric: 187 gCO2/kWh (46 gCO2/kWh heat)
- EV charging: 163 gCO2/kWh (43 gCO2/mile)
- Lighting appliances and cooking: 199 gCO2/kWh
Model vs measured
In the 2019 and 2020 reviews I compared our heating consumption in those years to the modelled heat demand from a SAP based energy assessment. I have since spent a bit more time looking at the original assessment assumptions and realise that space heating demand prediction given by SAP is highly dependent not just on the target temperature in the livingarea e.g 21C and the fabric assumptions but also the number of off hours assumed, the extent of the living area and the responsivness of the heating system. If we keep the target temperature the same at 21C the space heating demand prediction can be anywhere from a minimum of 8,558 kWh up to a maximum of 12,215 kWh depending on these non-fabric assumptions.
This makes it hard to give a single number for what the assessment suggests the space heating demand should be. It seems a fairer comparison to take the measured internal and external temperatures for each year, enter these in the SAP model to obtain a prediction for space heating demand and then compare that figure with the measured space heating demand. Here are the results of this comparison:
-
Predicted heat demand for 2019 based on measured internal and external temps: 7057 kWh, the actual space heat supplied was 5288 kWh = 25% less than the prediction.
-
Predicted heat demand for 2020 based on measured internal and external temps: 8286 kWh, the actual space heat supplied was 6011 kWh = 27% less than the prediction.
- Predicted heat demand for 2021 based on measured internal and external temps: 9202 kWh, the actual space heat supplied was 7328 kWh = 20% less than the prediction.
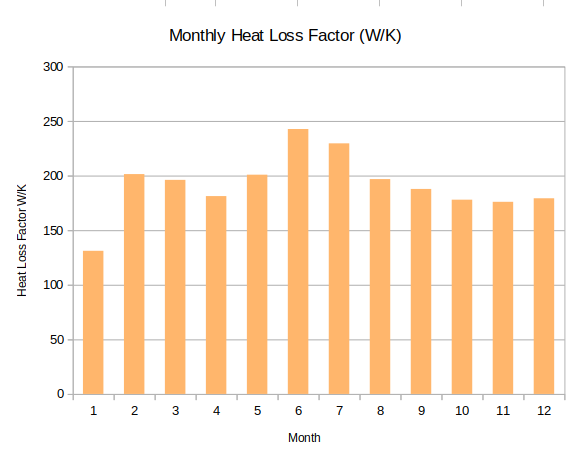
Calculating heat loss factors in W/K
Another approach to comparing modelled fabric performance with measurement is to calculate and compare heat loss factors. I go into the detail of how I do this in the 2020 blog post. It's again not quite possible to make a precise comparison as I still have to make assumptions for heat gains from water, body heat and solar gains. But it's interesting to try nonetheless.
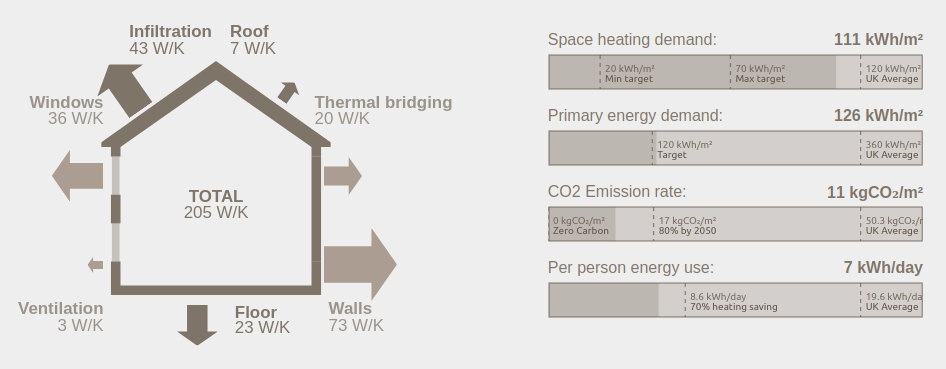
The chart on the left shows the resulting monthly heat loss factor values, varying between 131 and 243 W/K and an average of 192 W/K. The average is only 6.3% lower than the heat loss factor calculated using the SAP assessment as shown in the graphic on the right. This is quite a bit less than last year where the difference was 15%.
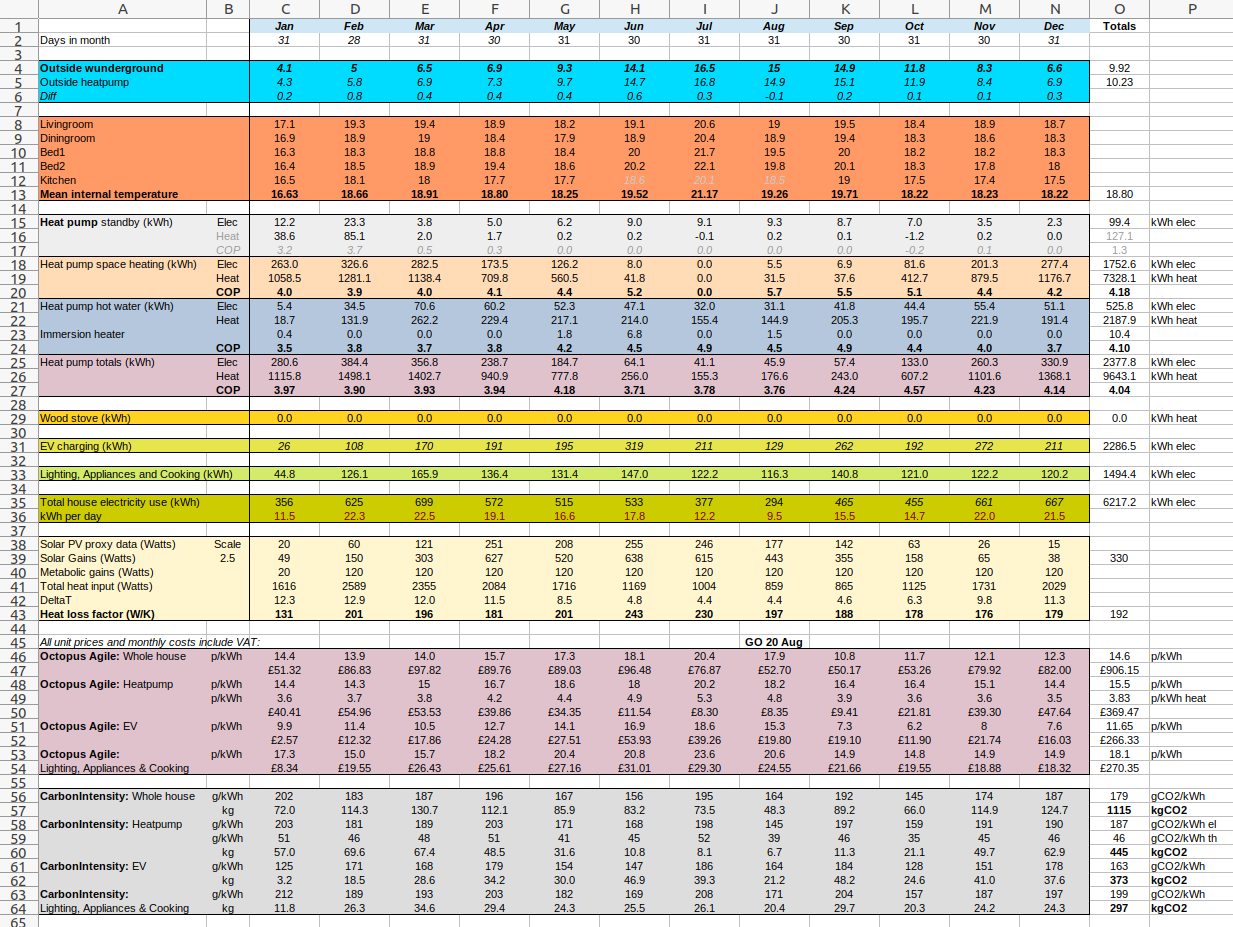
Detailed monthly data
The data for much of the analysis in this post was collected using our OpenEnergyMonitor monitoring system, I've written a more detailed post on the monitoring setup here: Monitoring. Here are the exported monthly temperature averages and consumption values for 2021:
Download heatpump2021.ods
Appendix
See appendix of 2020 post for discussion of carbon intensity and carbon savings discussion.