Heat pump: One year on, model vs measured
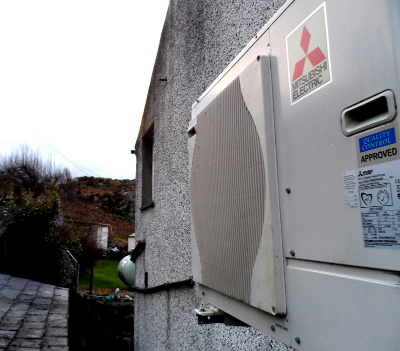
In early January 2019 I completed with the help of John Cantor (heatpumps.co.uk), Phil Jennings and my farther in law Colin Smith, the installation of a 5kW Ecodan air source heat pump to replace the not very functional multi-fuel stove supplemented with electric room heaters that was in the house previously. With almost a year now having passed it is a good time to evaluate how the heat pump performed.
In general terms I am really happy with the result, the heat pump has made the house much more comfortable, it provides a really nice even heat throughout the house. I've been particularly happy with the average space heating COP achieved throughout the year of 3.96 and a water heating COP of 3.52 (since adding the hot water cylinder at the start of November 2019 - 2 months).
COP: Coefficient of performance, e.g 3.96 for space heating means we are getting 3.96 kWh of heat for every 1 kWh of electrical input.
We have also needed much less heat than my original assessment predicted (45% less!) partly due to our preference for slightly lower internal temperatures than generally-recognised levels. The average radiator output in kW when the heat pump is running has also been much less than the design spec even when it is very cold outside, we have only needed 2-3kW of heat output and flow temperatures of 30-34°C rather than the maximum of 5.5 kW and flow temperature of 40-43°C suggested by my original calculations. The heat pump operates for longer when it's colder outside rather than running it at a higher flow temperature (e.g we may start at midday to bring the house up to temperature by the evening). When it's really cold (-1°C to 2°C) running the heat pump continuously at 30°C flow temperature for 24h+ seems to be sufficient to maintain a comfortable indoor temperature. In general it seems that the periods of low temperature are short enough, and thermal mass in the building fabric high enough, to even-out the extremes in temperature.
We also have a wood stove (81.4% efficiency) that can be used as a backup heat source, though we try not to use it from an air-quality perspective. Based on the volume of wood burnt it looks like it supplied about 4.6% of the annual space heat demand, we've mainly used it to boost the living room temperature quickly if we forget to turn the heat pump on early enough to bring the house to target temperature - but that's not very often.
I think the house could still benefit significantly from a whole house retrofit (See Retrofit Scenario), it would reduce heat demand further and we would likely increase internal temperatures as well. It would also make it easier to move the heat pump demand out of peak hours to benefit the grid and provide faster heat up times.
The following explores in more detail the difference between my original assessment and the measured space heat demand over the last year and tries to account for the difference.
1) Theory: 9679 kWh/year
The following table summarises the different theoretical space heating demand results I obtained, showing quite a large range of values:
| Assessment | Space heating demand |
|---|---|
| MyHomeEnergyPlanner | 9679 kWh/year |
| Room-by-room spreadsheet | 11762 kWh/year |
| Room-by-room heatlossjs | 12874 kWh/year |
MyHomeEnergyPlanner based on SAP 2012, performs a monthly heat loss calculation, suggests the following monthly space heating demand:
| Jan | Feb | Mar | Apr | May | Jun | Jul | Aug | Sep | Oct | Nov | Dec | |
|---|---|---|---|---|---|---|---|---|---|---|---|---|
| Space heat demand (Watts) | 2282 | 2109 | 1765 | 1292 | 800 | 0 | 0 | 0 | 0 | 1100 | 1723 | 2239 |
| Space heat demand (kWh) | 1698 | 1417 | 1313 | 930 | 595 | 0 | 0 | 0 | 0 | 818 | 1241 | 1666 |
Note: MyHomeEnergyPlanner value based on a slight modification to the original assessment but overall difference is minor 9679 vs 9714 kWh. I am not sure why the room-by-room heat loss calculations require so much more heat, I would like to revisit this difference.
2) Measured: 5288 kWh/year
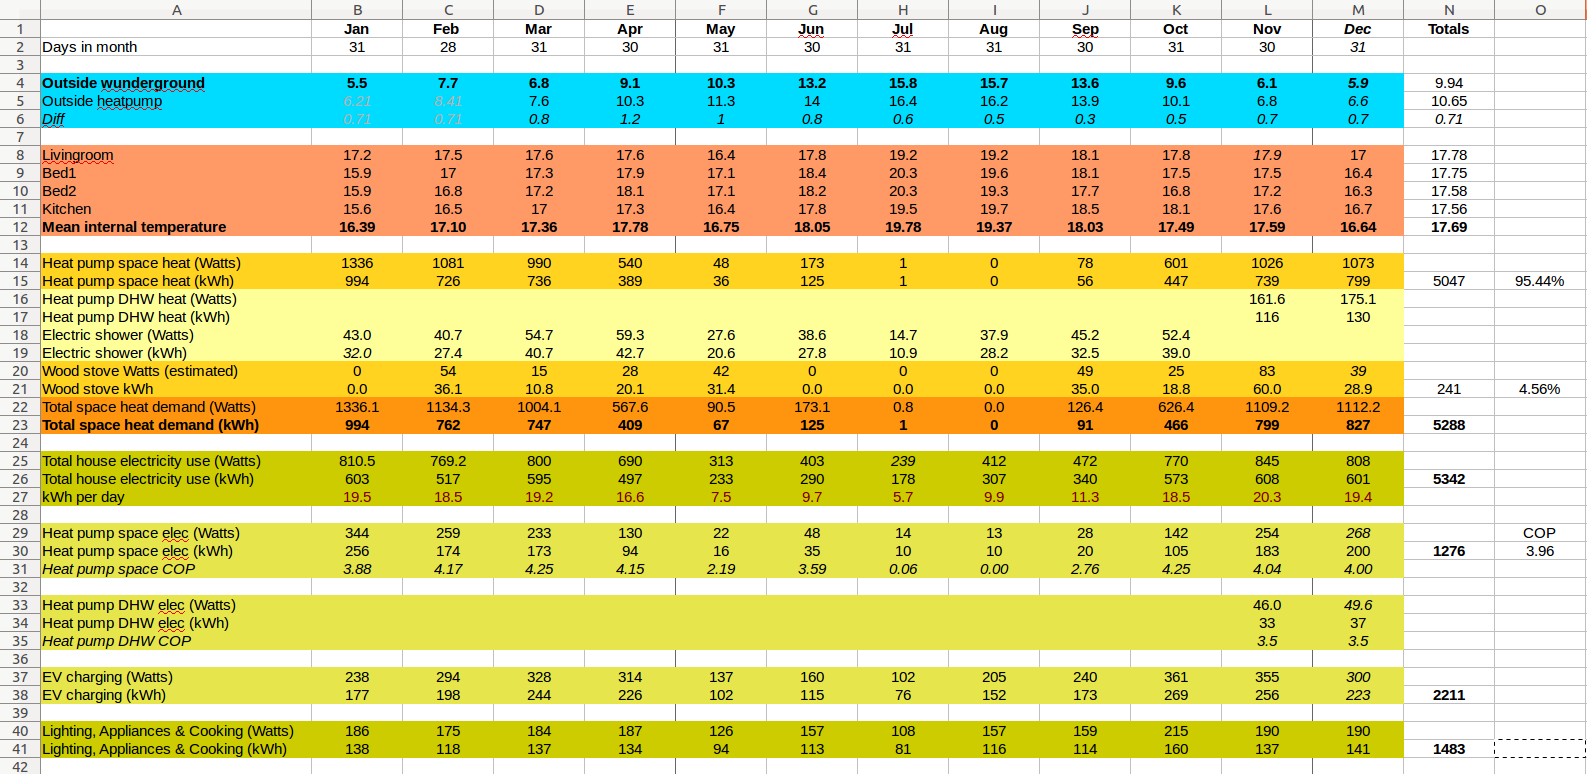
The following table is an export of monthly average temperatures and energy consumption recorded using our OpenEnergyMonitor monitoring system over the last year.
The total space heating energy input was 5288 kWh (heat) (95% of which was provided by the heat pump output at an average COP of 3.96), This is 45% less than the suggested heat demand by the SAP 2012 based MyHomeEnergyPlanner assessment! Or 52% less accounting for better real-world performance from the heat pump.
Measurement approach:
- Room temperatures are recorded using EmonTH wireless temperature and humidity nodes mounted at a common height of 1.5m in each room. The mean internal temperature is calculated as a weighted average by room volume.
- Heat pump heat output is measured using a Sontex Multical 531 heat meter and recorded using the Heatpump monitor via MBUS.
- Wood stove heat output was estimated by multiplying the room heat up period by a typical weight of wood burned (e.g. 9 kWh per hour of high output burn).
- Electric consumption on each circuit is measured using an EmonTx v3 running continuous sampling firmware.
Comparison with ZeroCarbonBritain, AECB & Passivhaus:
My electricity demand for space heating (heat pump input) is 5% lower than the average household electric for space heating demand in the ZeroCarbonBritain scenario for 2030 which assumes a much higher level of building fabric performance but lower heat pump performance. On a per m2 basis our house has a measured space heating demand of 69 kWh/m2.year, substantially higher than the passivhaus retrofit standard of 25 kWh/m2.year and the AECB building standard of 40 kWh/m2.year. It's worth noting of course that the passivhaus and AECB space heating demands would be even lower at the measured internal temperatures. This comparison is more for end use energy comparison rather than like-for-like building fabric performance comparison.
3) Accounting for the difference
I was expecting some difference between the assessment and measured result. The assessment is based on a standard internal target temperature of 21°C and I know our heating schedule target temperature is less than this. There is also likely to be a difference in assumed vs actual external temperatures and of course all the other assumptions from internal gains to build fabric U-values. In addition to heat demand I have also been monitoring some of these other properties and so can use this monitoring data as an inputs to the model that should then refine the result.
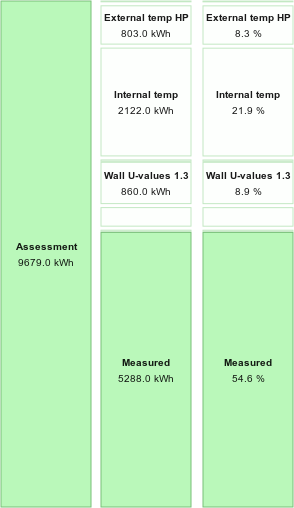
Starting point, My standard assumptions from MyHomeEnergyPlanner: (Heat demand: 9679 kWh)
External Temperature adjustment: (894 kWh less (or 9.2% less) = 8,785 kWh)
I've been monitoring external temperature with a waterproof DS18B20 temperature sensor attached to the air-inlet of the heat pump. I also have data from a local weather station less than a mile away. The weather station is 0.11K higher than the SAP annual average and 0.71K lower than the sensor on the back of the heat pump. Using the weather station data rather than the SAP 2012 dataset would reduce heat demand by 0.9%, using the heat pump external temperature sensor would reduce head demand by 9.2%.
Internal Temperature adjustment: (2122 kWh less (21.9% less) = 6,663 kWh)
I've been recording room temperatures using EmonTH wireless temperature and humidity nodes mounted at a common height of 1.5m in each room. The mean internal temperature is calculated as a weighted average by room volume. Using this internal temperature reduces model heat demand by 21.9%. The average measured internal temperature is 17.7°C, 1.5K lower than the average internal temperature suggested by SAP 2012 based on a living area target temperature of 21C.
Gains from lighting, appliances, cooking and DHW: (45 kWh less (0.5% less) = 6618 kWh)
Using monitored electricity data for lighting, appliances, cooking and heat pump DHW instead of assessment assumptions made relatively little difference as the predicted consumption was quite close in this case.
At this point I've managed to close the gap between the predicted heat demand and the measured heat demand from 45.4% to 20.1%. This is still quite a large discrepancy - but buildings are complex and there are still a lot of factors and assumptions in the model that may be incorrect. These could include but are not limited to:
- Assumptions made about building fabric U-values.
- Differences in solar irradiation and wind speeds compared to the SAP dataset.
- Heat contribution from neighbouring properties in the terrace.
- Over estimation of mean internal temperature.
- Measurement error for wood stove heat contribution
- Measurement error of heat meter, electricity monitoring and temperature sensors.
Wall U-values of 1.3 down from 1.7: (running total would be down to 5658 kWh, -11.9%)
If we adjust the U-values of the external walls down to 1.3 W/K.m2 in line with range of U-values measured by Historic Scotland in their research on stone wall U-values, the modelled heat demand would reduce by 11.9% to 5658 kWh.
Wall U-values of 1.1 down from 1.3: (5330 kWh, -7.4%)
If we adjust the U-values of the external walls down the lower end of those measured by Historic Scotland at 1.1 W/K.m2, the modelled heat demand would reduce by 7.4% to 5330 kWh, which is very close to our measured heat demand, with a remainder of 0.8% to account for.
My hunch is that the it is unlikely that the walls are the single factor and that its more likely that they are one factor amongst the others listed above, but it is interesting that we can get close with these adjustments.
Room-by-room heat loss calculation
In the room-by-room heat loss calculation based on BS EN 12831:2003 used by the MCS heat pump calculator I calculated the maximum space heat requirement to be 5523W at an external temperature of -3°C and standard internal temperatures. I upgraded all the radiators in the house to be double panel convector’s and increased surface area (see radiators listed in the calculator here). At a mean water temperature of 40°C these radiators should emit 4571W. At 30-34°C the temperature range we actually run the system at, the calculation suggests: 1871-2884W.
The lowest temperature I have recorded this year with the sensor at the back of the heat pump was -1.5C on December the 1st 2019, the days either side of this minimum where also the coldest continuous period this year. The mean 24h temperature (centred on the minimum) was 1.8°C, mean 48h temperature 2.5-3.0°C and mean temperature of the week 4.8°C. In the section on thermal mass here I calculated the amount of heat stored in the stone walls for a 10K elevation in internal temperature to be ~350 kWh, this is equivalent to 8 days of typical heat input in December, this suggests that the inside of the house will see an averaged outside temperature as the mass will dampen the extremes.
If I adjust the room-by-room heat loss calculation to use the average weekly external temperature of 4.8°C, adjust the unheated boundary to 17°C, and room temperatures to reflect measured average temperatures during this period: living room at 18°C rest of the house to 17.3°C the heat loss calculation suggests a heat demand of 2975W. If I adjust the external wall U-value to 1.3 W/K.m2 as above this drops further to 2753W. The radiator mean water temperature now only needs to be 31.3°C in theory to provide this heat output. We then subtract out of 2753W all the heat gains from solar gains, lighting, appliances and cooking, DHW and the people in the house, so the actual heat required from the heat pump is less still and well within the efficient operating range of the heat pump in this example. This said the internal temperatures in this example are lower than many might be happy with, We could have easily achieved higher temperatures during this period had we run the heatpump continuously and at a slightly higher flow temperature - or/and improved building fabric through efficiency improvements.
Hot Water demand
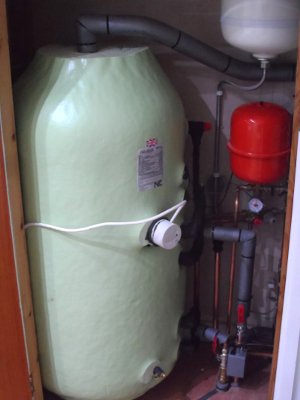
For the first 10 months of the year the heat pump supplied only space heating. We already had a functioning electric shower, So finishing DHW cylinder was not a priority. At the start of November we finally installed a new hot water cylinder with a larger surface area heat pump coil and plumbed in a new shower to replace the direct electric one. I've been very pleased again with the average COP achieved in DHW mode only of 3.52, this is a little lower than the space heating only COP of 3.96 which is to be expected given that the flow temperature is higher for a period of time, but still very good.
To achieve this COP we specifically heat the cylinder up to a target shower temperature of ~42°C and don’t mix in any cold water at the shower head. We selected a non-thermostatic mixer so as to avoid any risk of a slight unwanted trickle of cold that often results due to the seal not being perfect. We also generally heat the entire 150L cylinder in one heat up cycle per day. The flow temperature from the heat pumps tracks through from ~23°C all the way to ~46°C as the hot water cylinder heats up, the first 23-33°C can easily be above a COP of 4 and the final 40-46°C can be COP 3 or below, the average works out to around ~3.5.
How does our electricity use for hot water compare before and after using the heat pump?
In September and October we used on average 36 kWh for the electric shower, we also boiled the kettle for washing up, a single sink full requires about 0.17 kWh from the kettle, 1.5 sink full's a day would add another ~8 kWh a month suggesting a total of ~44 kWh/month (in these slightly colder months).
Since starting to use the heat pump for hot water we have used 35 kWh of electricity on average in November and December to run the heat pump for heating hot water. So only a ~20% reduction in electricity consumption compared to direct electric heating but an increase in heat delivered by ~2.8 times. The new shower is much more luxurious than the old electric shower, with much more water flow available and there are also additional losses in the system. Our hot water demand is however still 35% less than that suggested by SAP.
The hot water cylinder has 75mm of foam insulation and the connections are all well lagged. The 150L cylinder loses about 0.19K/hour at a water temp of 43°C, which is a heat loss rate of ~33W. Over 24 hours this results in 0.8 kWh of heat loss, but will likely be less given that cylinder is not kept at 42°C. Heating a tank of water from 12C to 43°C takes ~5.3 kWh (heat). So the heat loss from the cylinder could be around 10% of the energy required to heat it from cold. The other source of heat loss is from heated water standing in the pipes on the way to the sinks and shower. I would like to install a flow meter in the cold feed to the hot water cylinder to measure the heat output from the cylinder when water is being drawn to get a better grasp of how much heat is being used by the showers vs sinks, I also intend to dig into the SAP DHW calculator to get a better understanding of the losses assumed.