Transport Notes
Research notes on zero carbon or lower carbon transport, WORK IN PROGRESS.
In order to explore the energy consumption implications of total travel distance, modal shifts and electrification in the transport sector, the ZeroCarbonBritain scenario uses a transport model that starts by looking at how we travel today using available UK Government statistics before then modelling these changes to suggest a future scenario. The work below attempts to replicate and cross check the ZCB transport model in order to inform the 2019 update.
For passenger transport the ZCB model considers: Walking, Pedal Cycles, Electric Bikes & Scooters, Rail, Bus/Coach, Domestic Aviation, Motorbikes & Mopeds, Cars and Vans. International aviation and shipping is treated separately as aggregate fuel quantities.
The following UK Government statistics tables make it possible to build an overview of transport energy consumption, km travelled per person and per vehicle and therefore vehicle economy and load factors of each transport mode and are used in the modal summaries below.
- GOV.UK Transport Statistics Great Britain
- tsgb-2018/Modal/tsgb0101.ods provides modal passenger km travelled. [Ref 1]
- tsgb-2018/Roads and traffic/tra0101.ods provides road vehicle km travelled. [Ref 2]
- GOV.UK Energy consumption in the UK
- ECUK_Tables_2018_corrections.xlsx Table 2.02 provides road transport energy consumption by vehicle type. [Ref 3]
- ECUK_Tables_2018_corrections.xlsx Table 2.01 provides a source for total rail energy consumption. [Ref 4]
* 2016 is the most recent year for which energy and travel distances are available.
* The road transport energy consumption table 2.02 does not allocate biofuels and LPG per vehicle type and so a small adjustment is applied to take this into account, equal to a 3.55% increase on the stated per vehicle energy consumption.
* The per vehicle road transport energy consumption table 2.02 is also given in million tonnes of fuel rather than million tons of oil equivalent. A conversion of 12952 kWh/ton petrol, 12576 kWh/ton diesel and 11630 kWh/ton oil equivalent is used (see calculation in appendix), cross referencing the result with table 2.01 shows much closer correlation.
In addition to the summaries of the current state of transport in the UK, the sections below explore the potential impact of electrification and load factor on each mode. Examples are also given of conventional and electrified vehicles. These separate analyses are then combined at the end into an overall transport model that enables the exploration of changes in total distance travelled and modal shifts in addition to electrification and vehicle efficiency improvements.
A basic drag and rolling resistance physics approach to vehicle energy consumption is also explored.
Cars, Vans and Taxis
666.5 bn passenger km [1] and 404.8 bn vehicle km [2] were travelled by cars, vans and taxis in 2016 consuming 301.16 TWh of energy [3]. A per person economy of 0.452 kWh/p.km and per vehicle economy of 0.744 kWh/v.km. The average occupancy of cars in the UK is 1.65 based on passenger km divided by vehicle km. At 50/50 petrol/diesel the per vehicle economy works out to 39 MPG, CO2 emissions: 182 gCO2/v.km, 110 gCO2/p.km, 292 gCO2/v.mile, 177 gCO2/p.mile.
Increasing vehicle occupancy from 1.65 (33%) to 2.0 (40%) people per car could reduce energy consumption by 18% to 248 TWh and per person carbon emissions to 91 gCO2/p.km.
Alternatively increasing fleet efficiency to the real world MPG of a Hyundai Ioniq Hybrid of 61.5 MPG-UK could reduce energy consumption by 40% to 181 TWh and per person carbon emissions to 64 gCO2/p.km. A fleet wide economy of 61.5 MPG is perhaps unrealistically high given the wide variety of car and van types in the whole fleet.
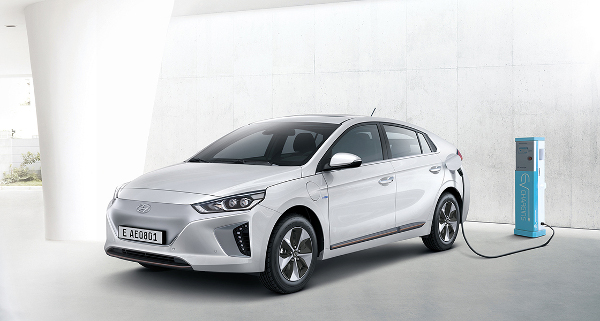
Complete electrification to the real world efficiency of the Hyundai Ioniq Electric of 0.154 kWh/v.km (includes charging losses), 0.093 kWh/p.km @ occupancy of 1.65, could reduce energy consumption by 79% to 62 TWh and per person carbon emissions of 26 gCO2/p.km at the UK grid carbon intensity of 283 gCO2/kWh in 2018 or 0 gCO2/p.km with a zero carbon grid.
The fleet average should cover of course a wide variety of car and van types, from small compact cars to large SUVs and vans. It is likely unrealistic to assume that the future electric vehicle fleet achieves the economy of the Hyundai Ioniq Electric which is itself one of the most efficient electric vehicles available today.
In order to get an idea of what a realistic electrified fleet efficiency might look like we also need to look at a range of electric vehicle models and understand their real world efficiency. This brings in another dimension of complexity as the European test procedures both NDEC and the newer WLTP both appear to overstate realistic range, there is an interesting discussion of the difference between NDEC and WLTP here. Based on my own experience of owning a Nissan Leaf and reading comments on EV forums, the US EPA ratings for EV range appear much more realistic.
Its worth noting that the US EPA EV efficiency ratings include charging losses, which at 120V can be ~80% and 240V about 90%. If you compare for example the EPA Nissan Leaf range rating to its efficiency rating 135km and 0.186 kWh/km it would suggest a battery capacity of 25 kWh. This is larger than both the battery capacity on a 24 kWh leaf and the usable capacity of 21.5 kWh. If the charging efficiency is 85% the efficiency after charging losses would be 0.158 kWh/km which over 135 km would use ~21.3 kWh in-line with actual usable battery capacity.
If we were to assume roughly a 3rd of vehicles obtained a high efficiency (Ioniq, Model 3) 0.155 kWh/v.km including charging, a 3rd at mid efficiency (Leaf, Model S) 0.181 kWh/v.km and another 3rd at lower efficiency SUV (Model X) 0.240 kWh/v.km the average efficiency would work out to 0.192 kWh/v.km including charging losses. This is equivalent to a fleet average of 3.7 miles/kWh as displayed on the car odometer - which does not include charging losses.
Potential electric car fleet average: 0.192 kWh/v.km, 0.0384 kWh/p.km @ 100% load factor (inc charging).
If half of all cars were high efficiency and a quarter each of the mid and lower efficiencies the fleet average would be 0.183 kWh/v.km including charging losses. Equivalent to a fleet average of 3.9 miles/kWh as displayed on the car odometer.
Assuming that the higher figure is more likely for now:
- With 5 people in a car the maximum per passenger economy would be 0.0384 kWh/p.km including charging losses.
- 404.8 bn vehicle miles at 0.192 kWh/v.km would require 78 TWh of electricity.
- If vehicle occupancy was increased to 2 people per car from 1.65 the electricity requirement would drop to 64 TWh.
- ZCB models a reduction in total distance travelled of 20%, a modal shift where cars make up ~60% of total travel compared to ~80% today and an increase in occupancy to 2 people per car, applying these changes to today's passenger km travelled figures halves total vehicle km to 200 bn km and would therefore result in an electricity demand of 38.4 TWh - an 87% reduction in energy demand.
Vehicle examples
|
Hyundai Ioniq Electric
Hyundai Ioniq Hybrid
|
|
|
Nissan Leaf 24 kWh
|
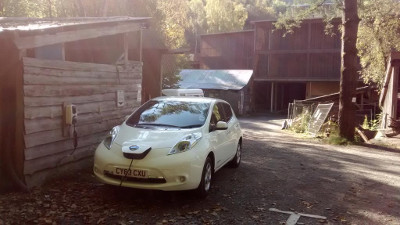 Nissan Leaf charging at CAT
|
|
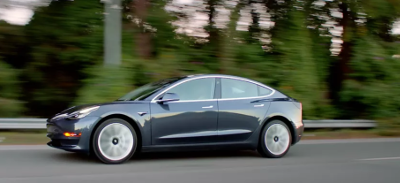
Tesla Vehicles
Reading through the Tesla 2019 EPA Cerificate of Compliance Application suggests that the charging efficiency is 87.5% for the long range Model 3. The Five Cyle Range was 334 miles given a derating factor of 0.7. The stated range is volunatily reduced to 310 miles. The AC efficiency is 0.167 kWh/km and DC efficiency 0.147 kWh/km (working backwards using the derating factor and charger efficiency). The Model 3 documents provide a similar charger efficiency of ~88%. https://pushevs.com/2017/08/01/tesla-model-3-efficiency-impressivehttps://pushevs.com/electric-car-range-efficiency-epa https://www.fueleconomy.gov/feg/Find.do?action=sbs&id=41189 |
|
|
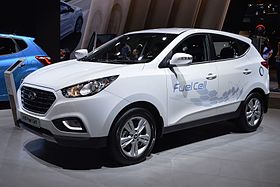
Hyundai ix35 Hydrogen Fuel Cell
The Toyota Mirrai gets 502 km on 5kg of hydrogen, a similar 0.392 kWh/km HHV NEDChttps://en.wikipedia.org/wiki/Toyota_Mirai The newer Hyundai NEXO has a 6.3 kg tank and a NEDC range of 805 km (0.308 kWh/km) or WLTP range of 666 km (0.373 kWh/km) Hyundai ix35 Petrol GDI 2016
If we assume a petrol engine efficiency of 28%, the equivalent electric drivetrain would have an economy of 0.623 kWh/km x 28% = 0.174 kWh/km. The fuel cell economy of the ix35 is 0.449 kWh/km HHV WLTP suggesting a fuel cell efficiency of 39%. This forbes article suggests that the NEXO fuel cell stack has an efficiency of 60% while previous models obtained 55%, 7% of the difference in efficiency may be using HHV vs LHV hydrogen values, but is it more likely that the difference is due to fuel cell efficiency curve in real world use? https://www.forbes.com/sites/sebastianblanco/2018/10/18/hyundai-nexo-drive/#5607076b275d |
|
Motorbikes
4.83 bn passenger km [1] and 4.51 bn vehicle km [2] were travelled by motorcycle in 2016 consuming 2.41 TWh of energy [3]. A per person economy of 0.499 kWh/p.km, per vehicle economy of 0.534 kWh/v.km and occupancy of 1.07. A vehicle economy equivalent to 51 MPG and 127 gCO2/v.km, 205 gCO2/v.mile
Electrification
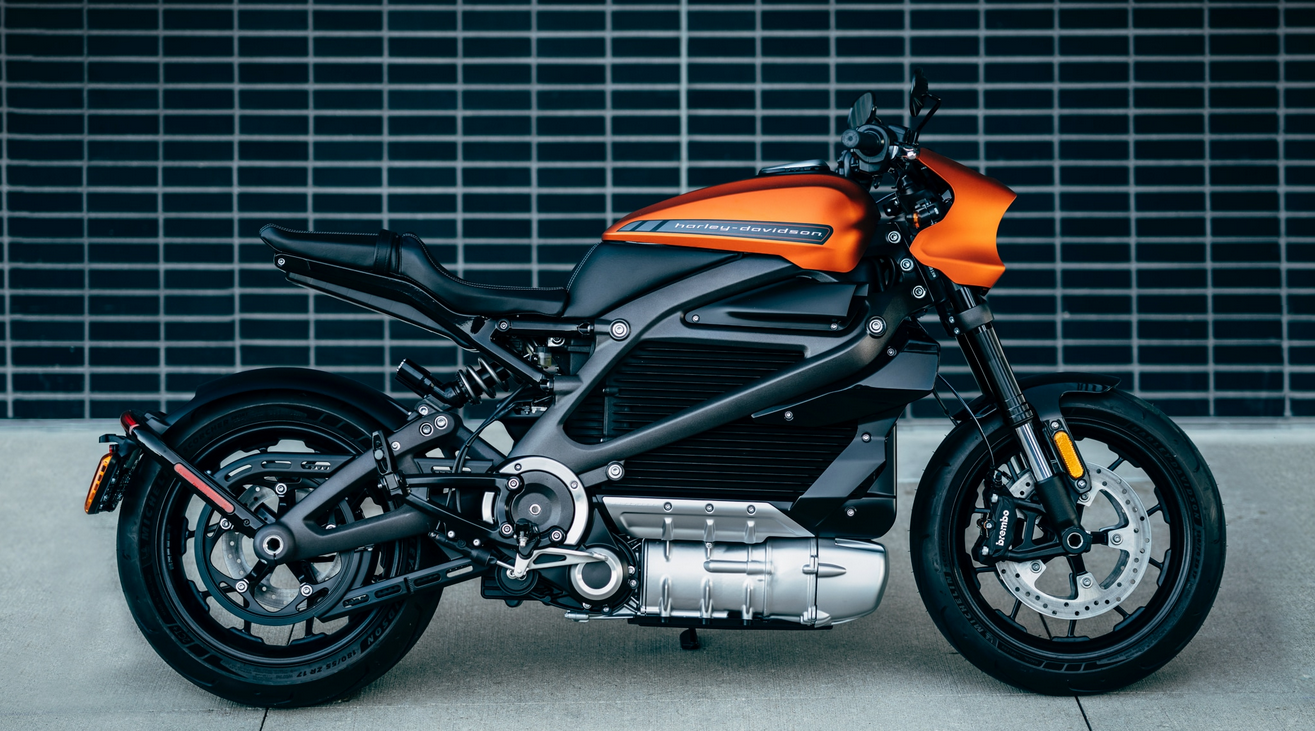
A mid range economy for the electric motorbike examples below is 0.065 kWh/v.km. Including a 10% charging loss this increases to 0.072 kWh/v.km. At an average occupancy of 1.07 the average economy should be 0.067 kWh/p.km.
Potential motorbike fleet average: 0.067 kWh/p.km (inc charging)
|
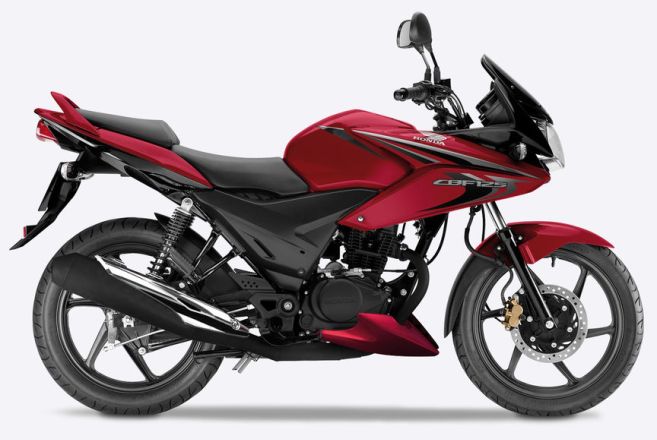
Electric Motorbikes The Harley-Davidson LiveWire has a city range of 140 miles (225 km) and combined stop-and-go highway range of 88 miles (142 km), estimated 7 kWh battery. https://www.harley-davidson.com/gb/en/motorcycles/future-vehicles/livewire.html 7 kWh divided by 225 km is 0.031 kWh/km, 7 kWh divided by 142 km is 0.049 kWh/km The Zero SR/F gets a combined range of 109-123 miles from 12.6 usable kWh https://www.zeromotorcycles.com/zero-srf. Assuming 116 miles (187 km) and 12.6 kWh suggests 0.067 kWh/km The Lightnight Strike electric superbike gets 70-100 miles from 10 kWh (0.073 kWh/km) or 150-200 miles from 20 kWh (0.071 kWh/km) https://www.motorcyclenews.com/advice/best/electric-motorbikes Petrol Motorbikes The most efficient motorbike listed in the following bennets article is the Honda CBF125 suggesting 160 mpg but most get around 80 mpg: https://www.bennetts.co.uk/bikesocial/news-and-views/news/2015/january/most-fuel-efficient-motorcycles On fuelly the Honda CBF125 gets ~ 102 mpg real world (http://www.fuelly.com/motorcycle/honda/cbf125) while the quoted 80 mpg Honda NC750X gets ~62 mpg (http://www.fuelly.com/motorcycle/honda/nc750x). The Honda CBR250R gets a real world fuelly 68 mpg. 100 mpg is 35.4 km/litre, 3.65 km/kWh or 0.274 kWh/km. 80 mpg is 0.343 kWh/km. Electric, Hydrogen and Synthetic fuels The difference between the Zero SR/F and the Honda CBF125 suggests that the ICE efficiency is around 24%. We might also guess that a hydrogen motorbike will get 0.167 kWh/km based on a fuel cell efficiency of 40%. |
|
Buses
34.36 bn passenger km [1] and 4.0 bn vehicle km were travelled by bus & coach in 2016 consuming 14.3 TWh of energy [3]. A per person economy of 0.416 kWh/p.km and per vehicle economy of 3.58 kWh/v.km. The average occupancy based on passenger km divided by vehicle km is 8.5. The vehicle economy works out to 8.4 MPG and CO2 emissions: 104 gCO2/p.km, 168 gCO2/p.mile, 897 gCO2/v.km, 1443 gCO2/v.mile.
A different uk gov statistics table gives the occupancy of local bus services in 2016 for the whole of great britain as 11.3 passengers per vehicle [B1].
A quick search for bus MPG suggests that a lower economy of ~5 MPG (6 kWh/km) is typical with newer hybrid buses achieving 6.1 mpg (5 kWh/km) and a potential of 7.7 mpg (3.9 kWh/km) [B2]. Another paper however suggests that a better economy is achieved today with modern urban cycle diesel buses at 4.13 kWh/km, the paper references multiple studies with a range of diesel bus economies of ~3.5 kWh/km to 4.9 kWh/km [B3].
The Mercedes Benz Citaro is perhaps a good example of a modern urban cycle bus, in testing it achived a fuel consumption of 38.7L/100 km [B4] which works out to 4.14 kWh/km (7.3 MPG). The same test found the economy for a Setra ComfortClass S 515 HD coach to be 21.0L/100 km [B4] (2.25 kWh/km, 13.4 MPG). A cleanmpg thread discuss similar values [B5].
A vehicle economy of 3.58 kWh/v.km and MPG of 8.4 MPG seems relatively high given many of the city bus type examples but may reflect significant mileage of long range higher efficiency coaches such as Setra ComfortClass pulling the average MPG up?
The Mercedes Benz Citaro has 26-31 seats and space for 60-74 standing (86-105 in total), the Setra ComfortClass S 515 HD has 51 seats. If we assume a 50/50 mix of both bus types, the average seating capacity is ~40 seats increasing to ~80 places with standing passengers. The standing spaces are of course useful for short city journey's in peak rush hour providing significant additional capacity while the seated capacities are more indicative of longer routes & more rural bus services. An average occupancy of 8.5 passengers per vehicle is a load factor of 21% on a 40 seat bus, or 11% at 80 spaces.
Increasing occupancy
The average load factor for buses is low and could in theory be increased substantially without adding additional vehicle miles. The average number of passengers per vehicle in London in 2017/2018 was 20.2, almost twice the national average for local bus services and 2.4x the average for all buses and coaches. 20.2 p/vehicle is a load factor of 50% seated, or 25% including standing. At 3.58 kWh/vehicle.km, 20.2 passengers would reduce the per passenger energy consumption to 0.177 kWh/p.km and per passenger CO2 emissions to 71gCO2/mile or 44gCO2/km.
- 8.5 passengers per vehicle: 0.416 kWh/p.km (average all)
- 11.3 passengers per vehicle: 0.317 kWh/p.km (average local services)
- 20.2 passengers per vehicle: 0.177 kWh/p.km (average London)
- 40.0 passengers per vehicle: 0.090 kWh/p.km (full seated)
- 80.0 passengers per vehicle: 0.045 kWh/p.km (full seated & standing)
Electrification
The electric bus examples below have an economy of 0.841-1.34 kWh/km. Demonstrating a similar reduction in energy consumption vs internal combustion to electric cars above. Taking a mid point of 1.09 kWh/v.km:
- 8.5 passengers per vehicle: 0.128 kWh/p.km (average all)
- 11.3 passengers per vehicle: 0.097 kWh/p.km (average local services)
- 20.2 passengers per vehicle: 0.054 kWh/p.km (average London)
- 40.0 passengers per vehicle: 0.027 kWh/p.km (full seated)
- 80.0 passengers per vehicle: 0.014 kWh/p.km (full seated & standing)
What might we expect the electric bus fleet average economy to be? It seems that taking the mid point 1.09 kWh/v.km would be a reasonable first step, applying a 10% charging loss would increase this to 1.21 kWh/v.km. If we assume that the average 100% load factor is a combined seating and standing space for 60 people the per person economy would be 0.020 kWh/p.km. This does not take into account how the additional weight of higher loading affects economy and is of course dependent on the actual number of seats & standing spaces in the bus in question.
Potential electric bus & coach fleet average: 1.21 kWh/v.km, 0.020 kWh/p.km @ 100% 60 passenger load factor (inc charging).
References
B1. https://assets.publishing.service.gov.uk/government/uploads/system/uploads/attachment_data/file/774589/bus0304.ods
B2. https://www.bbc.co.uk/news/uk-england-london-22625940
B3. http://www.tf.llu.lv/conference/proceedings2015/Papers/060_Graurs.pdf
B4. https://media.daimler.com/marsMediaSite/en/instance/ko/Promise-kept-demonstrably-lower-fuel-consumption-with-Euro-VI-certified-Mercedes-Benz-Citaro-and-Setra-ComfortClass.xhtml?oid=9904236
B5. http://www.cleanmpg.com/community/index.php?threads/45475
Comparisons
- CarbonIndependent: 100gCO2/p.mile based on allocated ~40% of bus emissions as a government service and 60% on a per passenger km basis: http://www.carbonindependent.org/sources_bus.html
- Resurgence carbon calculator, 176 gCO2/p.mile: https://www.resurgence.org/resources/carbon-calculator.html
|
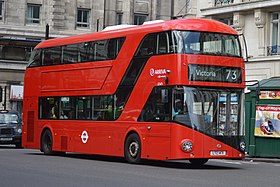
London Routemaster Hybrid
https://www.bbc.co.uk/news/uk-england-london-22625940 Electric buses Proterra BE35
https://www.proterra.com/products/35-foot-catalyst BYD K9
https://sgwiki.com/wiki/BYD_K9 BYD C9 Electric Coach
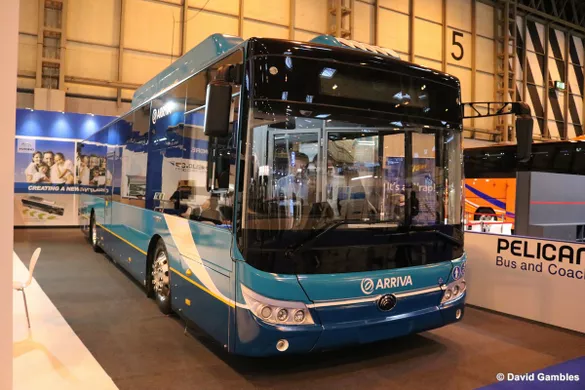
Yutong TCe12 Electric Coach
https://pelicanyutong.co.uk/coaches/tce12-electric-coach https://www.electrive.com/2018/04/11/flixbus-launches-first-long-distance-electric-bus-route-in-france http://www.dietrichcarebus.fr/arrivee-de-premier-autocar-100-electrique-yutong-ice-12 Yutong E10 Electric Bus
Yutong E12 Electric Bus
Example given of what appears to be the Yutong E12 obtaining efficiency of 0.8407 kWh/km in Shanghai and 0.920 kWh/km in Tianjin, China (Real world DC). |
 Routemaster Hybrid
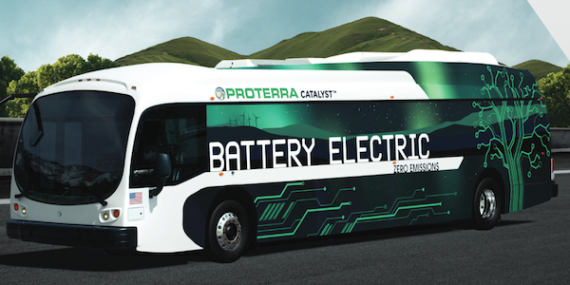 Proterra
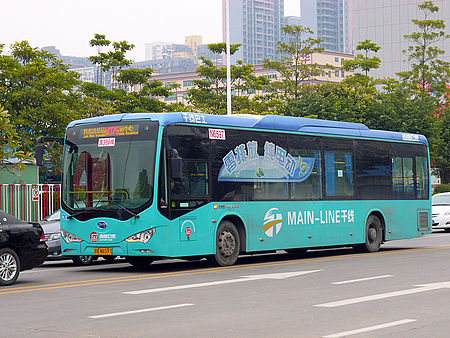 BYD K9
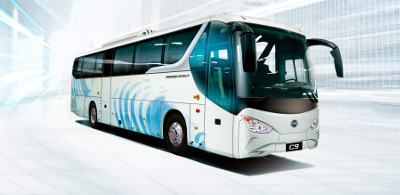 BYD C9
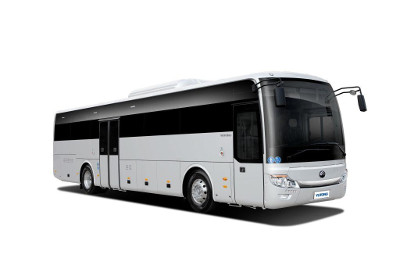 Yutong TCe12 Coach
 Yutong E12 Bus
|
Trains
79.67 bn passenger km were travelled by train in 2016 [1] consuming 11.96 TWh of energy [4]. A per person economy of 0.150 kWh/p.km. The DECC 2050 calculator gives a rail load factor of 32.4% for 2007 [T1], Other studies suggest similar load factors e.g [T2].
If the load factor was 100% the energy consumption per person km would be 0.0486 kWh/p.km or 4.86 kWh/p.100km. This compares well with examples given by David MacKay FRS in his book Sustainable Energy Without the Hot Air.
A diesel train with an economy of 0.09 kWh/p.km when full will emit 0.09 kWh/p.km x 250gCO2/kWh = 23 gCO2/p.km (37 gCO2/p.mile). At an average load factor of 32.4% this rises to 69 gCO2/p.km (111 gCO2/p.mile).
An electric train with an economy of 0.03 kWh/p.km when full, powered by the UK grid with an average carbon intensity of 283 gCO2/kWh in 2018 [T7] will emit 0.03 kWh/p.km x 283gCO2/kWh = 8.5 gCO2/p.km (13.7 gCO2/p.mile). At an average load factor of 32.4% this rises to 26 gCO2/p.km (42 gCO2/p.mile).
"Eurostar has said that the e3202 (electric) will consume 0.33 litres of petrol equivalent per seat over 100km" [T5] this is equivalent to 0.032 kWh/p.km, assumed to be at full occupancy.
Potential electric train fleet average: 0.03 kWh/p.km @ 100% load factor (more research needed).
The physics approach to train energy consumption included in the transport model spreadsheet discussed at the bottom suggests that a train travelling at the same speed as a bus or car should have around half the energy consumption. The Eurostar is a high speed train and so isnt the best comparison with slower moving cars and buses.
Comparisons
If you have used Loco2 to book European or UK train tickets you will likely have noticed the carbon saving calculation that compares train travel to air travel. Their calculation is based on the Eurostar emissions factor of 15.02gCO2/p.km [T4], I can replicate this result with either an old grid carbon intensity of ~500gCO2/kWh or a train load factor of ~57% at 2018 emissions levels and a train economy of 0.03 kWh/p.km.
References
T1. DECC 2050 Calculator
T2. https://orr.gov.uk/__data/assets/pdf_file/0004/3658/civity-toc-benchmarking-201112.pdf
T3. https://en.wikipedia.org/wiki/Railway_electrification_in_Great_Britain
T4. https://loco2.com/en-gb/blog/travel-green-calculating-your-carbon-savings
T5. https://www.businessgreen.com/bg/news/1869884/france-attempts-derail-eurostars-green-trains
T6. https://en.wikipedia.org/wiki/British_Rail_Class_230
T7. https://www.gov.uk/government/publications/greenhouse-gas-reporting-conversion-factors-2018
T8. http://withouthotair.com/cA/page_254.shtml
|
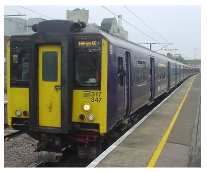
Electric train 1 London Tube High speed intercity train |
|
Trains vs buses and cars
The average train passenger energy consumption (0.150 kWh/p.km @ 32.4% load factor) is 64% less than the average for the bus fleet in the UK today (0.416 kWh/p.km @ 11-21% load factor). The UK bus fleet eke out an 8% lower per passenger km energy consumption than the UK car fleet (0.452 kWh/p.km @ 33% load factor). A rough calculation based on the diesel train economy above suggests that electrification may make up two thirds of the difference in the train vs bus comparison. 60% of all rail journeys are by electric traction [T3].
What happens if we electrify each mode completely and compete on a level playing field applying the same load factor of 30% to each mode?
Note: A 10% charging loss is added to the battery electric cars and buses.
- The Yutong E12 (real world tests) & BYD C9 electric coach win with 0.084-0.086 kWh/p.km
- The Generic high speed electric train comes in second at 0.100 kWh/p.km
- The Tesla Model 3 Standard Range comes in a very close third with 0.101 kWh/p.km
- The Eurostar e3202 comes in fourth at 0.107 kWh/p.km
- The Yutong E12 based on stated range and battery capacity would come in fifth at 0.111 kWh/p.km
- The Nissan Leaf comes in sixth at 0.120 kWh/p.km
Aircraft
9.16 bn domestic passenger km and 354.04 bn international passenger km were travelled by aircraft in 2017 [A1]. A total of 363.2 bn passenger km. 5500 km (3418 miles) per person. The total energy consumption for air travel domestic and international in 2017 was 151.13 TWh which works out to an average per passenger economy of 0.416 kWh/p.km.
2.063 bn aircraft km were flown suggesting an occupancy of 176 people per flight. The average load factor was 85%, suggesting 207 seats per aircraft.
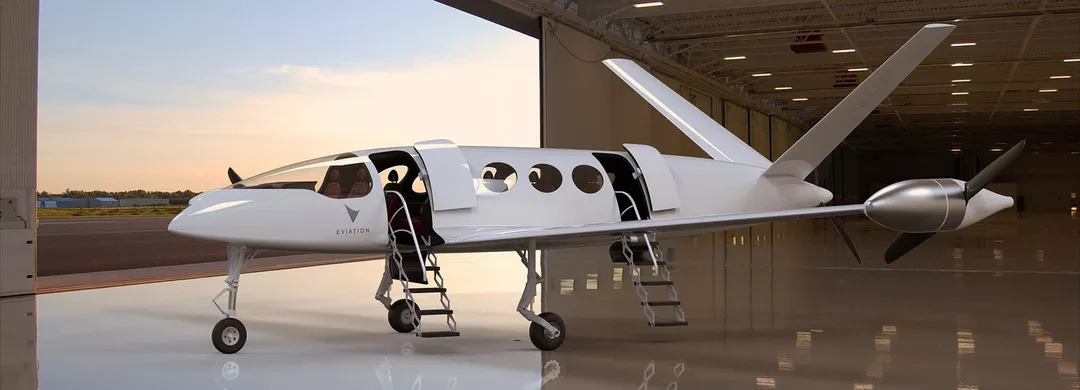
While there are promising developments in short range electric flight such as the proposed Eviation Alice Electric aircraft with 650 miles of range, significant breakthroughs in battery energy density are likely required to make longer distance travel a possibility.
Perhaps a more likely solution is to create synthetic liquid fuels using excess renewable energy which I discuss in more depth here: https://trystanlea.org.uk/aviation_notes. This is unfortunately not a perfect solution, its both energy intensive: over 10x the potential for high occupancy ground transport and requires additional negative emissions technology to offset the warming caused by the non CO2 radiative forcing's requiring still more energy and land.
References
A1: tsgb-2018/Aviation/avi0201.ods
|
Eviation Alice Electric aircraft (proposed)
Conventional Boeing 737-800
Eviation Alice suggests a 80% reduction in energy consumption per passenger km and further energy savings once synthetic fuel production is taken into account. |

|
Road Freight
|
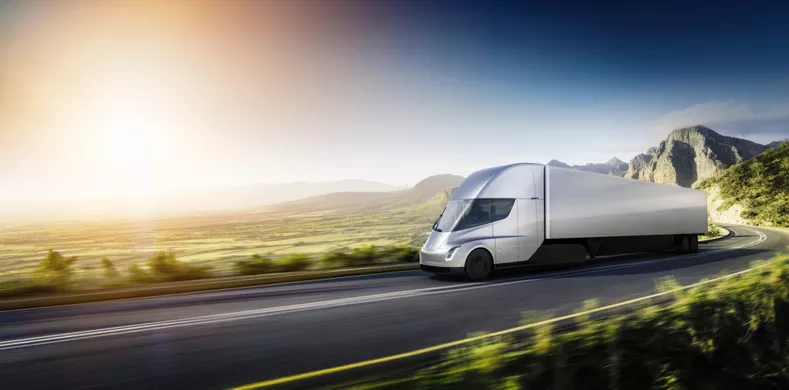
Volvo Trucks (ICE) Tesla Semi Emoss electric trucks UK Statistics (from ZCB model) |
|
Rail Freight
|
UK Statistics (from ZCB model) |
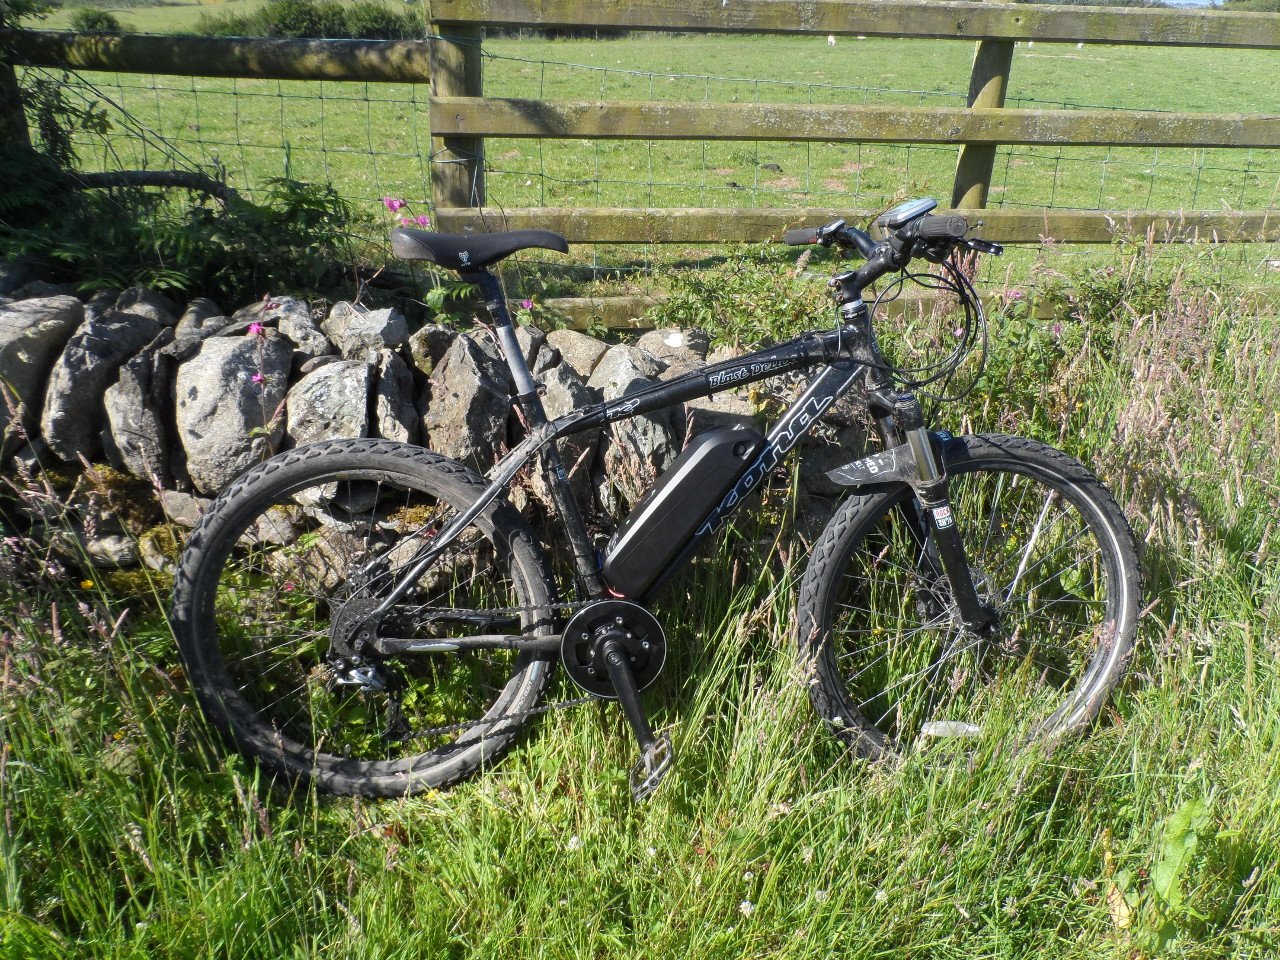
Electric Bikes
|
There where only 5.1 bn passenger km travelled by bike in 2016 [1] an average of 48 miles per person for the year - in comparison to 6299 miles per person by car, van & taxi. Could better cycling infrastructure and electric bikes help change that? The Netherlands travel about 15 bn km by bike, which with their smaller population works out to ~880 km per person (550 miles per person), an impressive 10x the UK average! Road vehicle travel in the Netherlands by comparison is 200 bn km, three quarters of which are done by car, 8800 km per person (5483 miles per person). The bosch range assistant gives an idea of typical ebike range, suggesting ~56 miles (90 km) from a 0.5 kWh pack based on a touring bike with hybrid tyres and the tour assist level. This works out to 112 miles/kWh, 180 km/kwh and 0.0056 kWh/p.km (0.0062 kWh/p.km inc charging loss), 30x less than an electric car with an occupancy of 1.0, 15x lower than ecar at 40% occupancy, 6x lower if ecar at full occupancy. From personal experience with more hilly terrain in Snowdonia, North Wales and higher assist levels it can be as low as 35 miles per 0.5 kWh pack which works out to 0.0089 kWh/p.km (0.010 kWh/p.km inc charging loss). 19x less than a electric car with an occupancy of 1.0, 9x less than ecar at 40% occupancy, 3.7x lower if ecar at full occupancy. |
|
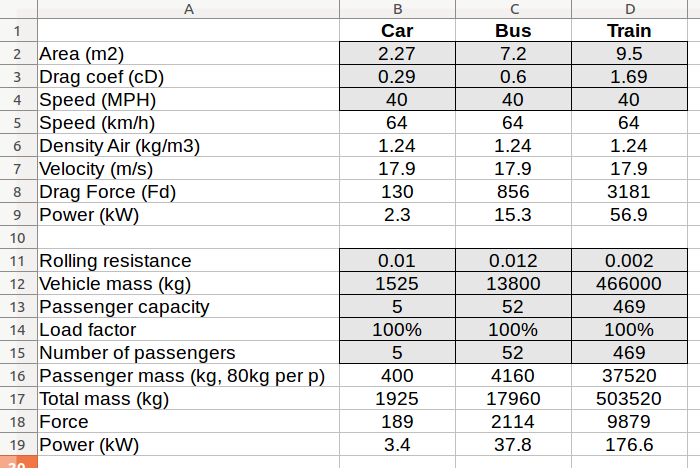
A physics approach
|
The above analysis attempted to reach an indication of fleet wide energy consumption potential for the different transport modes, but perhaps surprisingly electric train energy consumption came out to be similar to electrified buses and cars - even though trains have about 5x lower rolling resistance and ~8-22x less frontal area per passenger. Another way to gain insight into vehicle energy consumption is via a first principles physics approach. At a basic level we can look at the energy consumption required to overcome drag and rolling resistance at a constant speed. The transport model spreadsheet attached at the bottom of this page includes a page with a comparison for a car, bus and train which shows the train significantly out performing the car and bus - when all modes travel at the same speed. If the train travels at high speed ~120mph the energy consumption rises to a similar level to the Eurostar example above. |
|
Batteries, hydrogen & electro-fuels
|
The transport examples listed above cover a range of vehicles from battery electric through to conventional liquid or gas fuelled engines. Liquid and gas fuels can be produced via power-to-X processes and so are in theory a zero-carbon technology option provided the fuel is synthesised in this way. The efficiencies of the different routes are however quite different and the following diagram created by transport and environment gives a good overview: https://www.transportenvironment.org/sites/te/files/publications/Full_%20Roadmap%20freight%20buses%20Europe_2050_FINAL%20VERSION_corrected%20%282%29.pdfInteresting notes on overhead electric lines for trucks |
|
Things to watch above and in similar calculations elsewhere
- Load factors / vehicle occupancy makes a large difference to per passenger energy consumption and carbon emissions.
- Electrification makes a large difference to vehicle and per passenger energy consumption.
- Grid carbon intensity assumptions make a large difference to electric vehicle carbon emissions.
- Average transport mode speed
Energy content per ton of road transport fuel
1 ton of petrol is 1335 Litres @ 9.7 kWh/L: 12952 kWh/ton. 1 ton of diesel is 1175 Litres @ 10.7 kWh/L: 12576 kWh/ton. 32.6% of road transport fuel is petrol and 67.4% diesel suggesting an average kWh/ton of ~12699 kWh/ton. This compares to 11630 kWh/ton oil equivalent.
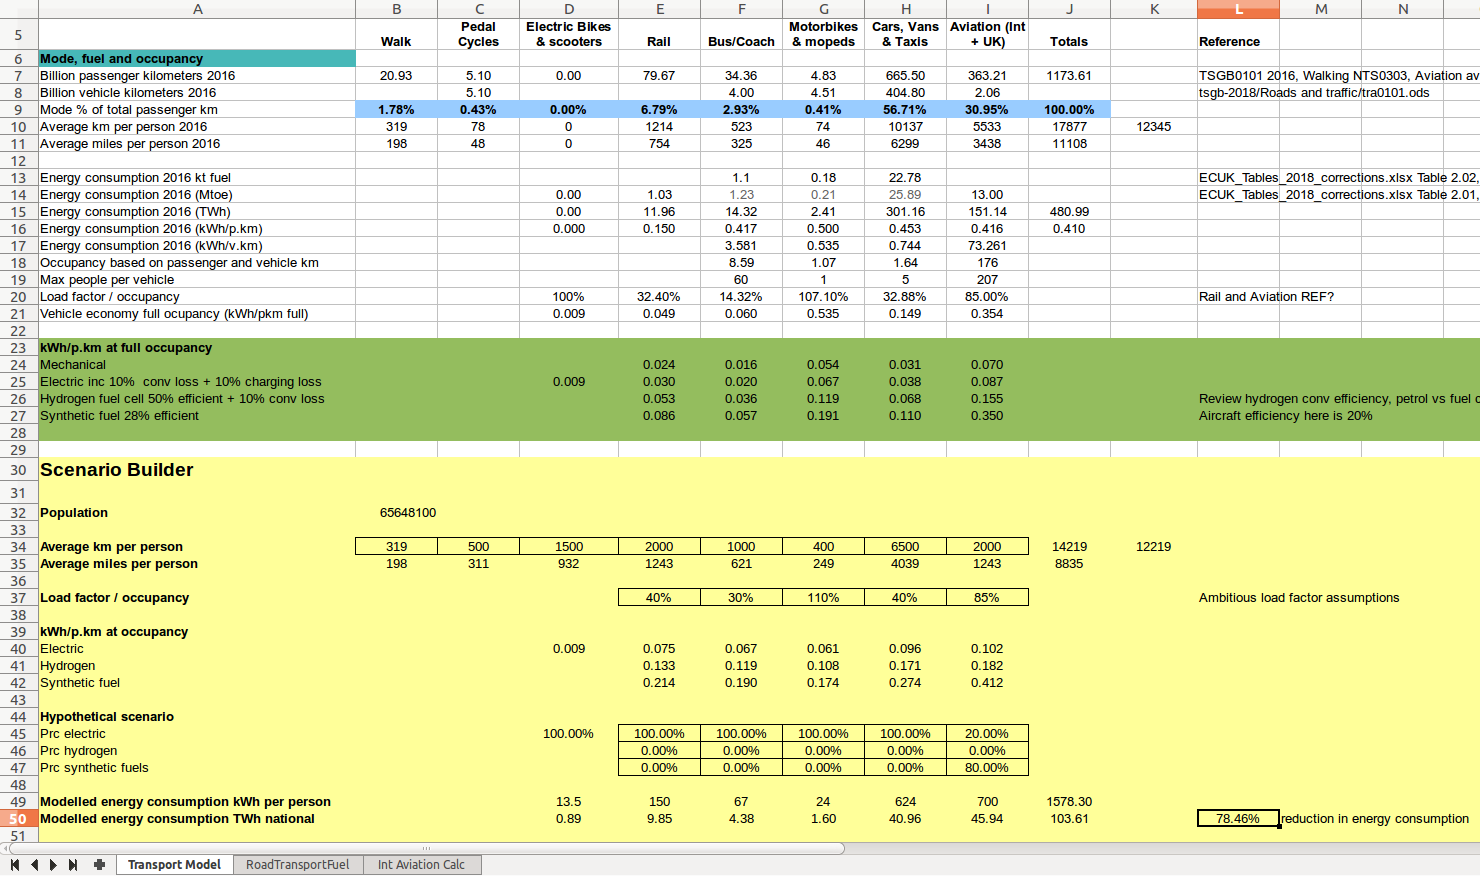
Transport Model
Draft transport model that includes much of the figures given above for current passenger km travelled and energy consumption. The model then builds a hypothetical scenario including a mix of modal shifts & technology switch:
Download: Transport_Model.ods