Heat pump performance and home energy 2020
The main changes in 2020 were:
- Warmer internal temperatures +1C average over the year. Increased comfort but also increased occupancy with working from home due to the pandemic and the new baby.
- 12 months of water heating for showers etc from the heat pump, rather than only the last two in 2019.
- We are now on the Octopus Agile time of use electricity tariff, the analysis below includes our agile costs.
This is 43% cheaper than what we would have paid had we required the same amount of heat with a gas boiler on mains gas (31% less without standing charge). The CO2 reduction is 82% compared to mains gas based on actual time of use grid carbon figures. See comparison calculation in the appendix.
Heat pump performance overview
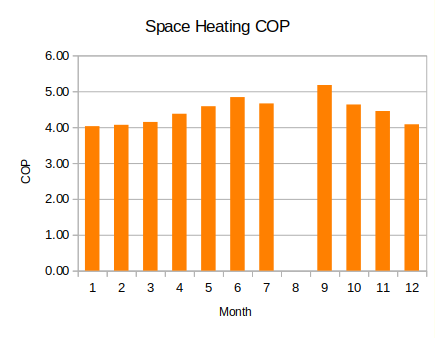
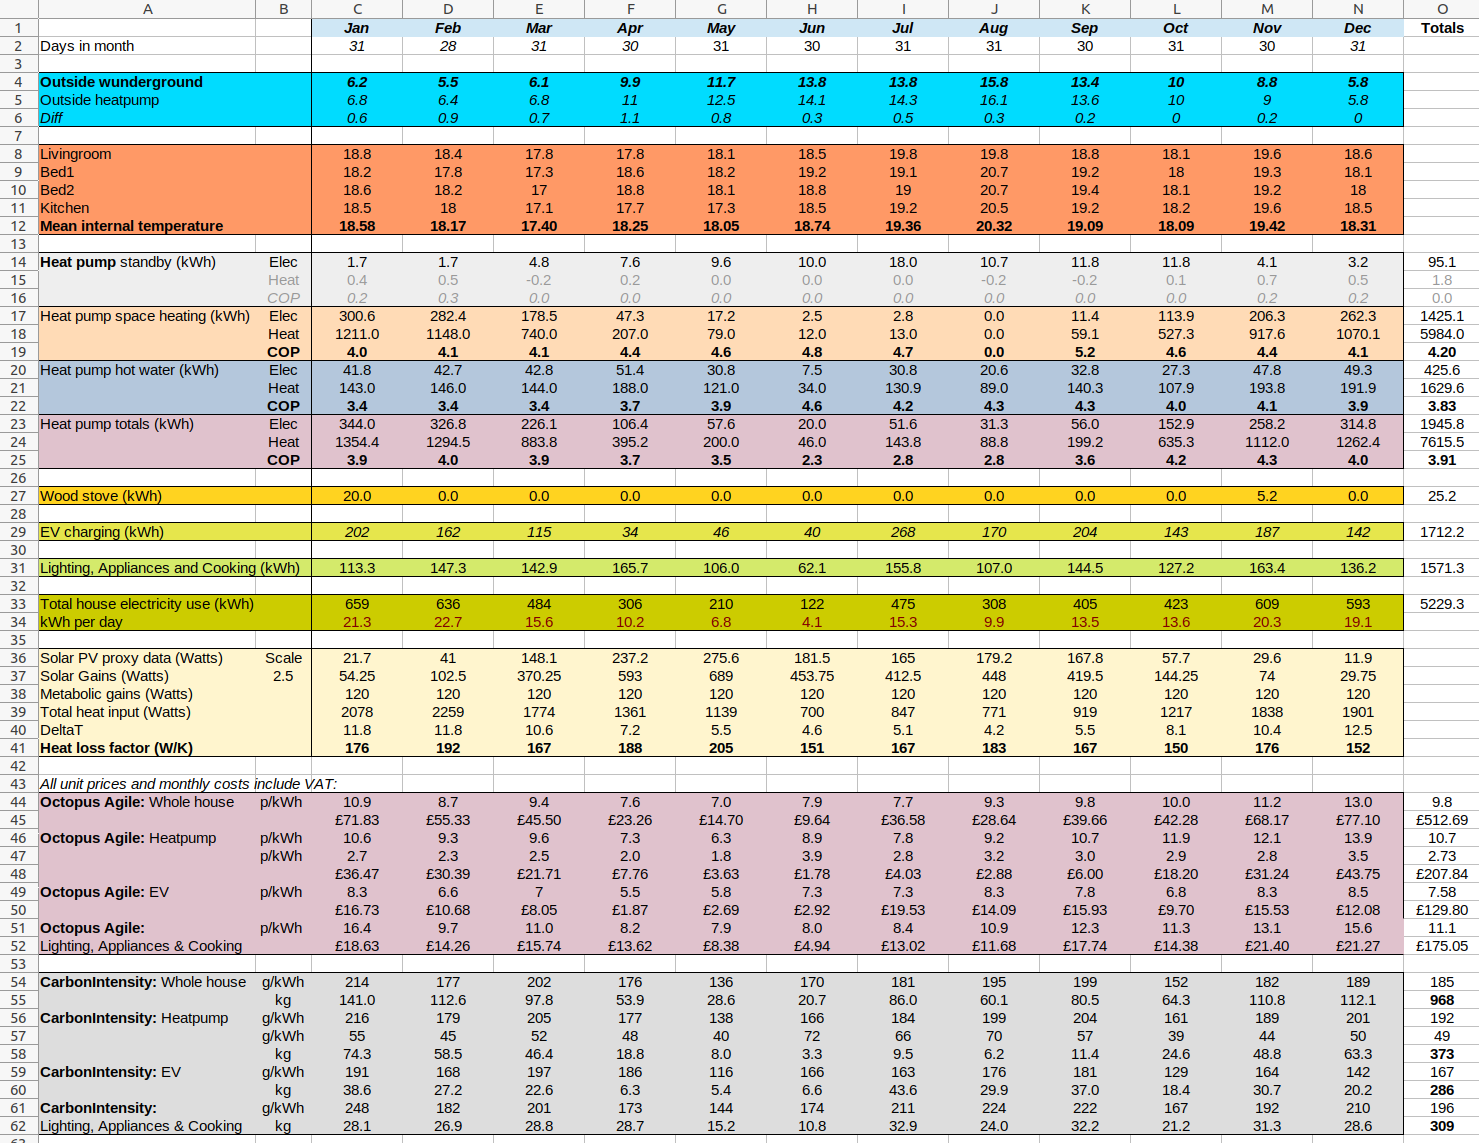
- Annual space heating COP average: 4.2
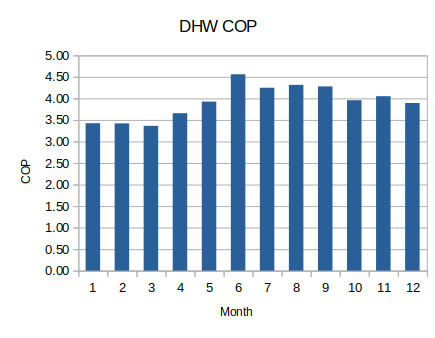
- Annual domestic hot water COP: 3.83
- Standby electricity consumption: 95.1 kWh
- Combined space heating and DHW COP (not including standby): 4.11
- Combined space heating, DHW and standby COP: 3.91
I managed to seperate out the standby electricity consumption of the heat pump and so the following monthly COP figures for space heating and domestic hot water (DHW) are specifically for the periods of time that the heat pump is running. This shows higher COP's in the summer than the winter as we would expect given higher outside temperatures. The combined COP chart includes this standby consumption and we can see that it drags down the summer COP's.
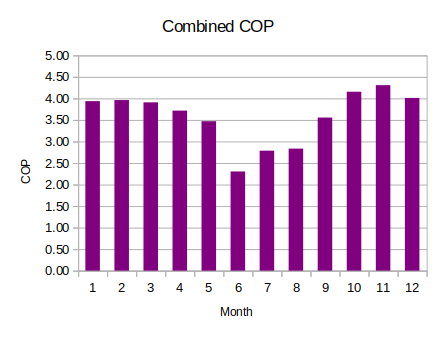
The average annual COP of 3.91 was very slightly lower than the 2019 figure of 3.93. This difference is not really significant but one reason may be that the heat pump provided 12 months of hot water heating rather than only the last two in 2019.
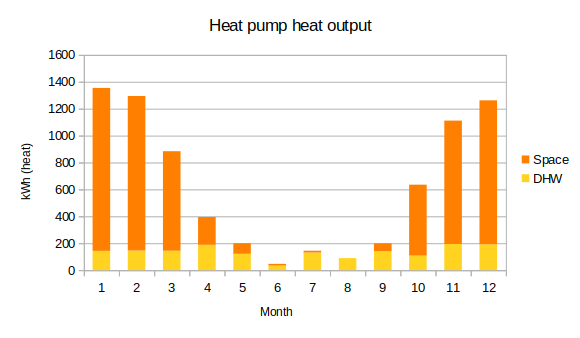
The following charts show the electricity consumption of the heat pump separated out again by space heating, hot water and standby. Standby consumption increases in summer as the heat pump spends a lot more hours on standby.

Standby allocation:
The higher space heating COP of 4.2 compared with 3.96 is primarily due to separating out the standby electricity consumption that was included in the 2019 space heating figure. With standby included, this would drop the apparent space heating COP to 3.94, but not change the overall combined heat pump COP result of course. This goes to show that how standby consumption is allocated can change the COP figures for any breakdown between space and water heating. The important figure for overall system performance is the combined COP of 3.91.
Water heating:
The water heating COP is perhaps surprisingly high, one of the key factors leading to this high performance is that we only heat the cylinder up to 40-42C twice per day. I meant to setup an automatic regular legionella pasteurisation cycle last year, but I only performed a small number manually as I'm still working on the heat pump controls. Theoretically extrapolating a weekly legionella pasteurisation cycle, using the heat pump to bring the cylinder to 53C (flow temperature 60C) and then the immersion to top the cylinder up to 60C suggests that the average annual DHW COP would drop by 5-8%, from 3.83 down to 3.56-3.64. A daily pasteurisation cycle would drop the DHW COP by about ~30% to 2.68. I estimate that the combined COP including space heating and standby would drop from 3.91 to 3.86 with a weekly cycle and 3.58 with a daily cycle. I intend to give more attention to Legionella protection this year, including testing the water to check bacteria levels, I will share the results in a separate blog post once I'm further along with it.
Octopus Agile costs and Grid Carbon Intensity
- Total electricity cost of £589.34 for 5229 kWh (inc VAT & standing charge)
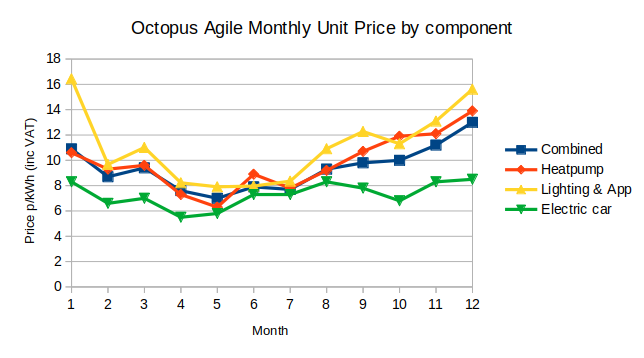
(Coving all our standard electric, 99.7% of our heating and about 70% of our driving). - Annual average unit price for whole house: 9.8 p/kWh (inc VAT)
- Annual average unit price of electricity for the heat pump: 10.7 p/kWh (inc VAT)
- Annual average unit price for the electric car: 7.6 p/kWh (inc VAT)
- Annual average unit price for the lighting, appliances and cooking: 11.1 p/kWh (inc VAT)
- A saving of £496 compared to our previous tariff which had a unit rate of 18.86 p/kWh!
- The average household spends about £2500 on home energy and petrol every year (see calculation here).
Our energy costs look to be about a quarter of this, but a sizeable chunk of the saving
goes to pay back the additional up front cost of the electric car and heat pump.
The first chart on the left shows how the average unit cost of the electricity supplied to the different loads changes over the year. We can also see how the electric car which is primarily charged overnight has a lower average unit cost than the heat pump which is used more during the day. Traditional lighting, appliances and cooking electricity demand is higher as expected given that these are used more during peak hours.
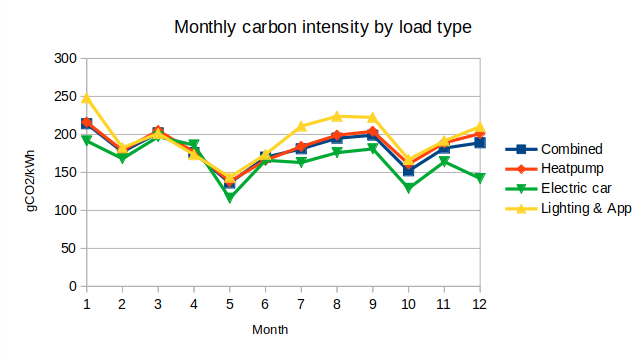
Again here we see that the overnight electric car charging has the lowest intensity whilst day time loads such as the heat pump and lighting etc is higher.
Annual averages:
- Combined: 185 gCO2/kWh
- Heat pump electric: 192 gCO2/kWh (49 gCO2/kWh heat)
- EV charging: 167 gCO2/kWh (44 gCO2/mile)
- Lighting appliances and cooking: 196 gCO2/kWh
Model vs measured
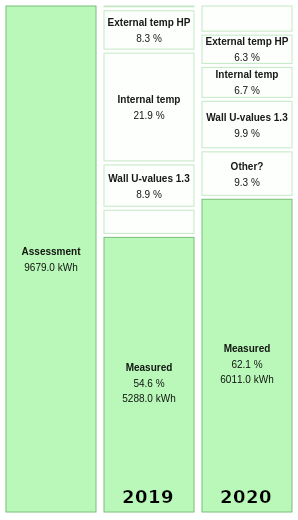
In the 2019 review I compared our heating consumption in that year to the modelled heat demand from a SAP based energy assessment. We used 45% less heating energy than the assessment suggested. I can account for 2/3rds of that as being due to lower average internal temperatures and higher outside temperatures for that year.
In 2020 we used 14% more heating energy, narrowing the gap between model and measurement from 45% to 38%. In 2019 our average indoor temperature was 17.7C (warmer during heating periods of course). In 2020 the average indoor temperature to 18.7C, partly reflecting increase in comfort and partly being at home more.
The stacks on the left show warmer than assessment external temperatures and lower internal temperature now make up about half of the difference rather than 2/3rds.
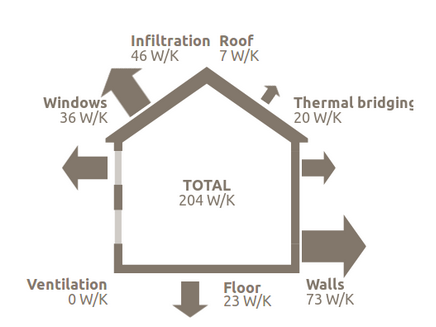
Calculating heat loss factors in W/K
To isolate the performance (or lack thereof) of the building fabric and air-tightness from all of the other factors that determine final heating energy requirements, I've worked out in the monthly table below an estimate for the heat loss factor in Watts per Kelvin (W/K).
The heat loss factor should be equal to the sum of all sources of heat, including gains from electricity consumption, body heat of occupants (metabolic gains), solar gains through windows and hot water gains, divided by the difference in temperature between the average internal temperature and the outside:
Heat loss factor = (Heating system input + Lighting, Appliances & Cooking electric consumption + DHW gains + Solar gains + Metabolic gains) / DeltaT
I've assumed that 100% of Lighting, Appliances & Cooking electric consumption ends up being used for heat and 50% of hot water heat. The metabolic gains are set at 60W per person (SAP assumptions). The solar gains are estimated based on solar PV data from a near-by home scaled by trial and error to provide a level set of W/K values through the year.
The chart on the left shows the resulting monthly heat loss factor values, varying between 151 and 205 W/K and an average of 173 W/K. The average is 15% lower than the heat loss factor calculated using the SAP assessment as shown in the graphic on the right. It's not perfectly precise but at least suggests that our heat loss is lower than the value calculated in the assessment, not higher.

Detailed monthly data
The data for much of the analysis in this post was collected using our OpenEnergyMonitor monitoring system, I've written a more detailed post on the monitoring setup here: Monitoring. Here are the exported monthly temperature averages and consumption values for 2020:
Download heatpump2020.ods
Appendix
-
Improved controls: In October I improved the heat pump controls to automate scheduling with a combination of room and flow temperature based set point profiles for each day. Rather than run the heat pump in a single continuous block, it now cycles at a low frequency much as any normal thermostat would work, the average flow temperatures can be lower this way when outside temperatures are milder and so the COP is higher. It would be better if the heat pump could modulate it's heat output down further, but Im limited by the minimum compressor speed of our heat pump.
-
Carbon Intensity: I would like to caveat the carbon intensity calculations, whilst I find it interesting, this kind of carbon intensity analysis is far from perfect. It doesn’t really capture what the aggregate effect would be if everyone consumed electricity at what are currently times of low demand and low intensity, nor does it capture a more complex view of long term electricity system decarbonisation and adoption curves of measures like switching to heat pumps or EV’s. Octopus agile is also a renewable tariff. Views differ of course on how these factors should be accounted for. I’ve added the above analysis as a point of interest more than anything.
-
Gas boiler comparison: Assuming a 80% efficient gas boiler, gas unit rate of 2.919 p/kWh, standing charge of 17.85 p/day (Octopus 12M tariff) and mains gas carbon intensity of 210 g/kWh (SAP), our heating cost assuming the same amount of delivered heat would have been £343.02 and CO2 emissions 1999 kg. Gas boilers also have electricity consumption associated with the central heating pump and standby requirements, SAP suggests between 156-165 kWh/year for the central heating pump. Standby may add another 50-60 kWh to this. If we assume 220 kWh of electric this would add £23.54 at 10.7p/kWh (Agile prices) and 42.24 kg of CO2 (at 192 gCO2/kWh). The total cost for 7615.5 kWh of delivered heat would therefore have been £366.56 and total CO2 2041.31 kg. This gives a heat unit cost of 4.81 p/kWh and CO2 intensity of 268 gCO2/kWh.
- Electric vs diesel car comparison: The Underestimated Potential of Battery Electric Vehicles to Reduce Emissions, Auke Hoekstra suggests 244 g/km for the diesel Mercedes C 220d including manufacturing and 95 g/km for the Tesla Model 3 with 74 kWh NCA battery, again including manufacturing and battery production. The emissions for the driving component alone is 217 g/km vs 55 g/km respectively. At my average charging electricity intensity of 167 gCO2/kWh and a combined charging and driving efficiency of 6.0 km/kWh, I get 28 g/km for my driving emissions, which is 87% less than a relatively efficient diesel car (for the driving component). I haven't compared manufacturing emissions here as the Mercedes C 220d and Tesla Model 3 would be an apples and oranges comparison with a 24 kWh Nissan Leaf, however Auke Hoekstra'a paper gives a good idea of what the carbon reductions can be.